Negative Impact of Caloric Restriction on Atherosclerosis in Young ApoE/LDLr -/- Mice
bDepartment of Basic Sciences, Faculty of Veterinary Medicine, University of Agriculture in Kraków, Redzina 1C, 30-248 Krakow, Poland,
cDepartment of Microbiology, Faculty of Medicine, Collegium Medicum, University of Rzeszów, al. Rejtana 16C, 35-959 Rzeszów, Poland,
dDepartment of Drug Addiction Pharmacology, The Institute of Pharmacology of the Polish Academy of Sciences (IF PAS) Department of Drug Addiction Pharmacology, Smetna 12, 31-343 Kraków, Poland,
eDivision of Molecular Biology and Clinical Genetics, Faculty of Medicine, Jagiellonian University Medical College, Skawinska 8, 31-066 Krakow, Poland,
fDepartment of Clinical Biochemistry, Faculty of Medicine, Jagiellonian University Collegium Medicum, Skawińska 8, 31-066 Kraków, Poland,
gCenter for Innovation and Research on Prohealthy and Safe Food, University of Agriculture in Kraków, Balicka 104, Kraków, 30-149, Poland
Keywords
Abstract
Background/Aims:
Caloric restriction (CR) has proven to be the most effective dietary intervention for reducing cardiovascular disease (CVD) associated with obesity. Depending on the age of the mice the effect of caloric restriction was diverse. Therefore, the effect of CR on the development of atherosclerosis in young and adult ApoE/LDLr-/- mice was evaluated.Methods:
Eight-week-old and 20-week-old male mice received a control diet. Young mice were fed for eight weeks, whereas adult mice for 5 weeks. To assess whether individual housing influenced the tested parameters, control animals were housed in colony cages (AL) or individually (stressAL; sAL) and fed ad libitum . Individually housed caloric restriction (CR) mice received a 30% less diet compared to AL group.Results:
The body weight of CR mice was significantly lower compared to the AL and sAL groups. TCh and LDL levels were significantly increased in young CR mice. No differences in adult animals were observed. TAG levels significantly decreased in both young and adult CR mice. CR induced atherosclerosis in young mice. The FMO3 gene was upregulated in young animals. Microbiota composition changed. At the genus level, compared to the control, CR group exhibited a higher relative abundance of the Enterococcus, Clostridium_sensu_stricto_1 , Rikenella and a lower relative abundance of the CAG_352 (P< 0.05) genera.Conclusion:
Caloric restriction exacerbated atherosclerosis in young ApoE/LDLr-/- mice.Introduction
Caloric restriction (CR) involves reducing caloric intake by approximately 20% to 50% compared to ad libitum feeding. It decreases overall food consumption without altering essential nutrient levels, ensuring adequate intake of vitamins, minerals, and amino acids.
According to Omodei and Fontana (2011), CR is the most effective nutritional intervention for preventing chronic diseases in rodents [1]. Guo et al . [2] demonstrated that dietary restriction reduces atherosclerosis in the aorta of ApoE-/- mice. Additionally, Lefevre et al . [3] confirmed that caloric restriction, both alone and in combination with exercise, influences cardiovascular disease (CVD) risk. Therefore, long-term caloric restriction is effective in reducing the risk of atherosclerosis in humans [4].
The mechanisms underlying the beneficial effects of caloric restriction remain poorly understood. To date, little is known about the effects of CR on mice at different ages [1, 5]. Harrison et al . [6] demonstrated that a 40% caloric restriction increases mortality in 4-week-old mice but extends lifespan when initiated in middle age. Similarly, Sheng et al . [5] reported that CR has detrimental rather than beneficial effects in young mice. Kostogrys et al . [7] observed differences in metabolic activity between young and middle-aged CR mice fed the AIN-93 diet [8].
The impact of caloric restriction on the development of atherosclerosis in young and adult ApoE/LDLr-/- mice has been assessed. Microarray analysis of the liver and microbiota in the feces has been conducted to clarify the mechanism of caloric restriction.
Materials and Methods
Animals and Feeding
All procedures were conducted following the European Union Guidelines for Animal Care and Treatment. The experiments were approved by the I Local Animal Ethics Commission in Kraków (Medyczna 9, 30-688 Kraków, Poland) under approval number 28/2016.
ApoE/LDLr-/- male mice (Jackson Laboratory, USA) were bred at the Department of Human Nutrition and Dietetics, Faculty of Food Technology, University of Agriculture in Kraków. The animals were housed under standard conditions (22–25°C, 12-hour light/dark cycle). Eight-week-old mice (without atherosclerotic lesions) and twenty-week-old mice (with pre-established atherosclerotic lesions) were fed the AIN-93G diet (Table 1) for 8 and 5 weeks, respectively [8]. Control animals in the ad libitum (AL, n=6) and stress ad libitum (sAL, n=6) groups were fed without dietary limitations. Daily dietary intakes were weighted and reported. Caloric restriction animals (CR, n=6) received a 30% less diet compared to the AL group. AL mice were housed in colony cages, whereas sAL and CR were housed individually in cages. Body weights were monitored weekly.
At the end of the experiment, mice were injected intraperitoneally with 1000 IU of heparin (Sanofi-Synthelabo, Paris, France). After 10 minutes, they were anesthetized with an intraperitoneal injection of ketamine/xylazine (20 μl, 100 mg/ml). Mice were then sacrificed by cervical dislocation.
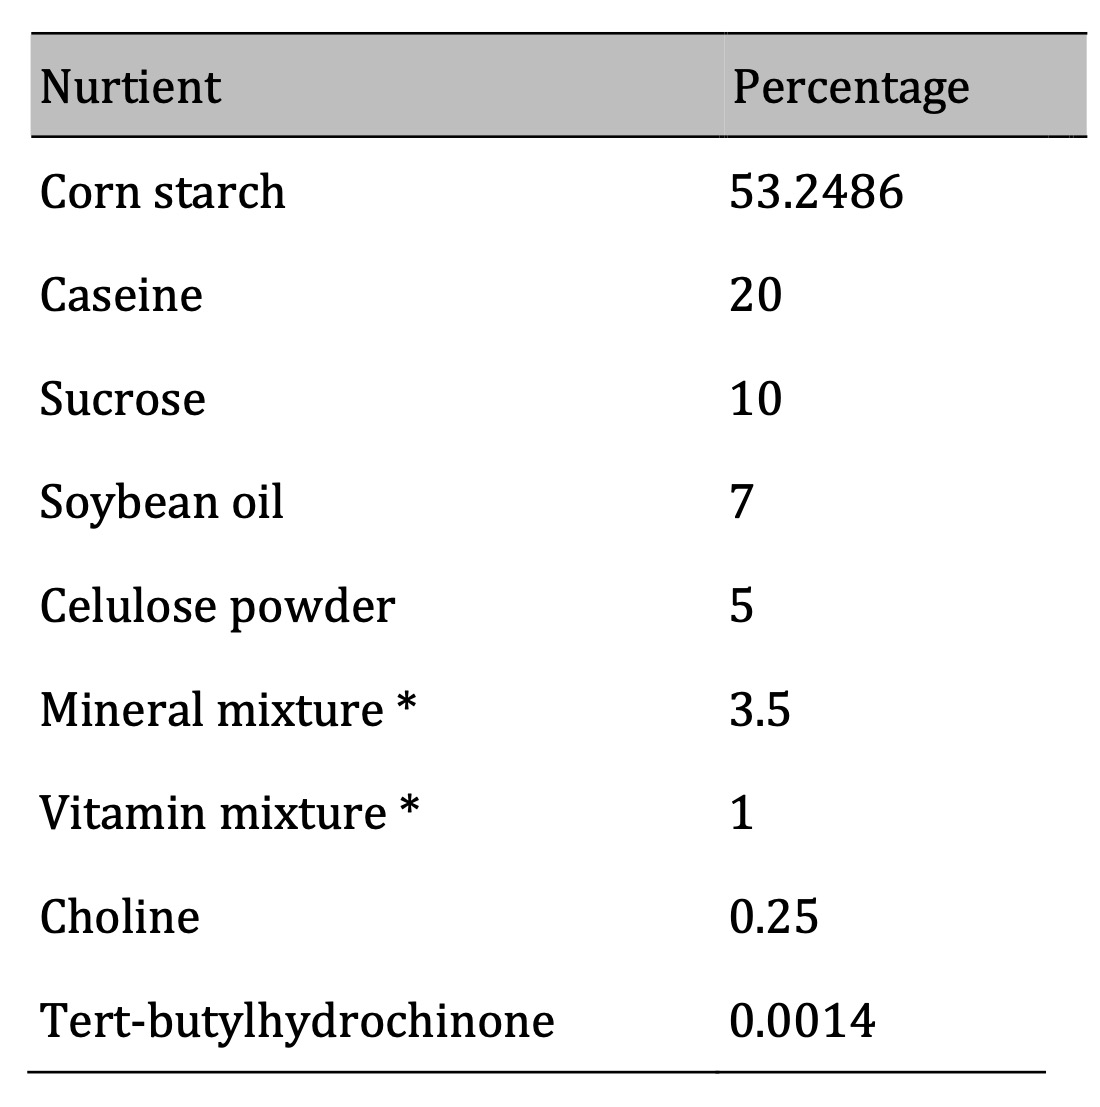
Table 1: Composition of experimental diet (%). * According to Reeves, 1993
Blood Sampling and Biochemical Marker Measurements
Blood samples were collected from the vena cava into test tubes, centrifuged at 13, 000 × g for 4 minutes to obtain plasma, and subsequently stored at -80°C. Lipid profile parameters, including total cholesterol (TCh), low-density lipoprotein (LDL), high-density lipoprotein (HDL), and triglycerides (TAG), were analyzed using a Pentra 400 analyzer (Horiba). The following reagents were used according to the manufacturer’s instructions (HORIBA ABX, BP 7290, 34184 Montpellier, France) via an enzyme-photometric method: ABX PENTRA CHOLESTEROL CP (No.: A11A01634), ABX Pentra LDL Direct CP (No.: A11A01638), ABX Pentra HDL Direct CP (No.: A11A01636) and ABX PENTRA Triglycerides CP (No.: A11A01640).
Atherosclerosis Analysis in the Entire Aorta (En Face) and Aortic Roots (Cross-Sectional Analysis)
The entire aorta, from the arch to the bifurcation, was dissected, fixed in 4% formaldehyde, opened longitudinally, and pinned onto black silicone plates. The pinned aorta was stained with Sudan IV (Sigma-Aldrich, St. Louis, MO, USA) to visualize atherosclerotic plaques. The lesion area was measured using LSM Image Browser software, and the percentage of the atherosclerotic plaque area relative to the total aortic surface was calculated.
For aortic root analysis, serial cryosections (10 µm) were prepared and stained with Oil Red O (ORO). The total lesion area was measured semi-automatically on each slide using LSM Image Browser 3.2 software (Zeiss, Jena, Germany). For each animal, the mean lesion area was calculated from nine sections.
Microarray Analysis
Livers were excised, weighed, and a part of the liver from each mouse was frozen in liquid nitrogen before storage at -80°C. After thawing, samples were homogenized in liquid nitrogen using a mortar and pestle, and the resulting powder was used for RNA isolation. Total RNA was extracted using the RNeasy Mini Kit (Qiagen, The Netherlands) following the manufacturer’s protocol. RNA concentration and quality were assessed using an Agilent 2100 Bioanalyzer, with only samples having RIN ≥ 7 included in the analysis.
Gene expression was analyzed using the SurePrint G3 Mouse Gene Expression 8×60K Microarray (Agilent Technologies, USA). The Agilent Two-Color Microarray-Based Gene Expression Analysis protocol was followed. Briefly, 100 ng of total RNA was reverse-transcribed into complementary DNA (cDNA) and subsequently transcribed into complementary RNA (cRNA) in the presence of cyanine 3-UTP. Hybridization was performed at 65°C for 17 hours with rotation, followed by washing to remove nonspecific binding. Microarrays were scanned using Agilent’s High-Resolution C Scanner, and raw data were extracted with Feature Extraction software (v10.10.1.1, Agilent Technologies, USA). Data normalization and processing were performed using GeneSpring GX software (v12.1, Agilent Technologies, USA). Differential gene expression (DE) analysis was conducted using an unpaired t-test. P-values were adjusted for multiple testing using the false discovery rate (FDR) correction according to the Benjamini and Hochberg method [29]. Genes with FDR < 0.05 were considered significantly differentially expressed.
Microbiome the Analysis by Next-Generation Sequencing
The feces from mice were collected. DNA was isolated using QIAamp DNA Stool Mini Kit (QIAGEN, Germany) according to the manufacturer’s instructions. 16S rRNA gene libraies comprising V3-V4 gene regions were prepared directly following Illumina 16S Metagenomic Sequencing Library Preparation protocol (https://emea.support.illumina.com/downloads/16s_metagenomic_sequencing_library_preparation.html). Sequencing was performed on the MiSeq system (Illumina, San Diego, CA) with 2x300bp paired-end run. The obtained raw sequencing reads were demultiplexed and analyzed with the use of QIIME2 [30] software. In brief, the analysis steps involved primary read quality control, filtering, denoising, and feature table generation with the use of DADA2 [31] software. Alpha and beta diversity indexes analysis was done with the q2-diversity QIIME2 plugin with 3, 000 sampled reads selected based on analysis of the refraction curve. Alpha diversity indexes included common diversity measures, such as Observed Features and Shannon’s diversity index (as a qualitative measure of community richness), Faith’s Phylogenetic Diversity (a qualitative measure of community richness that incorporates phylogenetic relationships between the features), and Evenness (or Pielou’s Evenness; a measure of community evenness). Beta diversity was evaluated based on indexes, such as Jaccard distance, Bray-Curtis distance (a quantitative measure of community dissimilarity), unweighted UniFrac distance, and weighted UniFrac distance (as a quantitative measure of community dissimilarity that incorporates phylogenetic relationships between the features). Calculated alpha and beta diversity indexes were compared among study groups by Kruskal-Wallis or PERMANOVA tests (for alpha and beta diversity metrics, respectively). The taxonomic classification of reads was done using a pre-trained Naive Bayes classifier (sklern) and the q2-feature-classifier plugin. The used classifier was trained on the Weighted Greengenes 13_8 99% OTUs database, which collects full-length 16S sequences as suggested in QIIME2 manual. The final differential abundance comparison among the study groups was made on filtered (for abundance) taxa set using MicrobiomeAnalyst [32] software and implemented EdgeR [33] analysis method. Differential abundance was considered if false discovery rate (FDR) was <0.05 for a given taxon.
Analysis of the Correlation Between Blood Glucose Levels, Lipid Profile, and Microbiome Composition
The correlation between microbial data and blood glucose levels, as well as lipid profile data, was analyzed using JASP statistical software. Data distribution was assessed using the Shapiro-Wilk test. Subsequently, Pearson’s correlation coefficient was applied for correlation analysis.
Statistical Analysis
Data were presented as mean ± SEM. Statistical analyses were performed using the STATISTICA 10 software package (StatSoft Inc., USA). Analysis of variance (ANOVA) was conducted, followed by Tukey’s post-hoc multiple range test, with significance set at P < 0.05.
For microarray gene expression analysis, GeneSpring 13.0 (Agilent Technologies, USA) and Reactome pathway analysis (Fabregat et al ., 2018) were used.
Results
Effect of CR on Body Weight
The body weight of caloric-restricted ApoE/LDLr-/- mice significantly decreased compared to AL and sAL animals (Table 2). Young mice exhibited a body weight reduction of 6.52 g, whereas adult mice showed a slightly smaller decrease of 5.97 g. The most pronounced weight loss occurred during the first week of the experiment, with reductions of 5.9 g in young mice and 7.0 g in adult mice (Supplementary File 1).
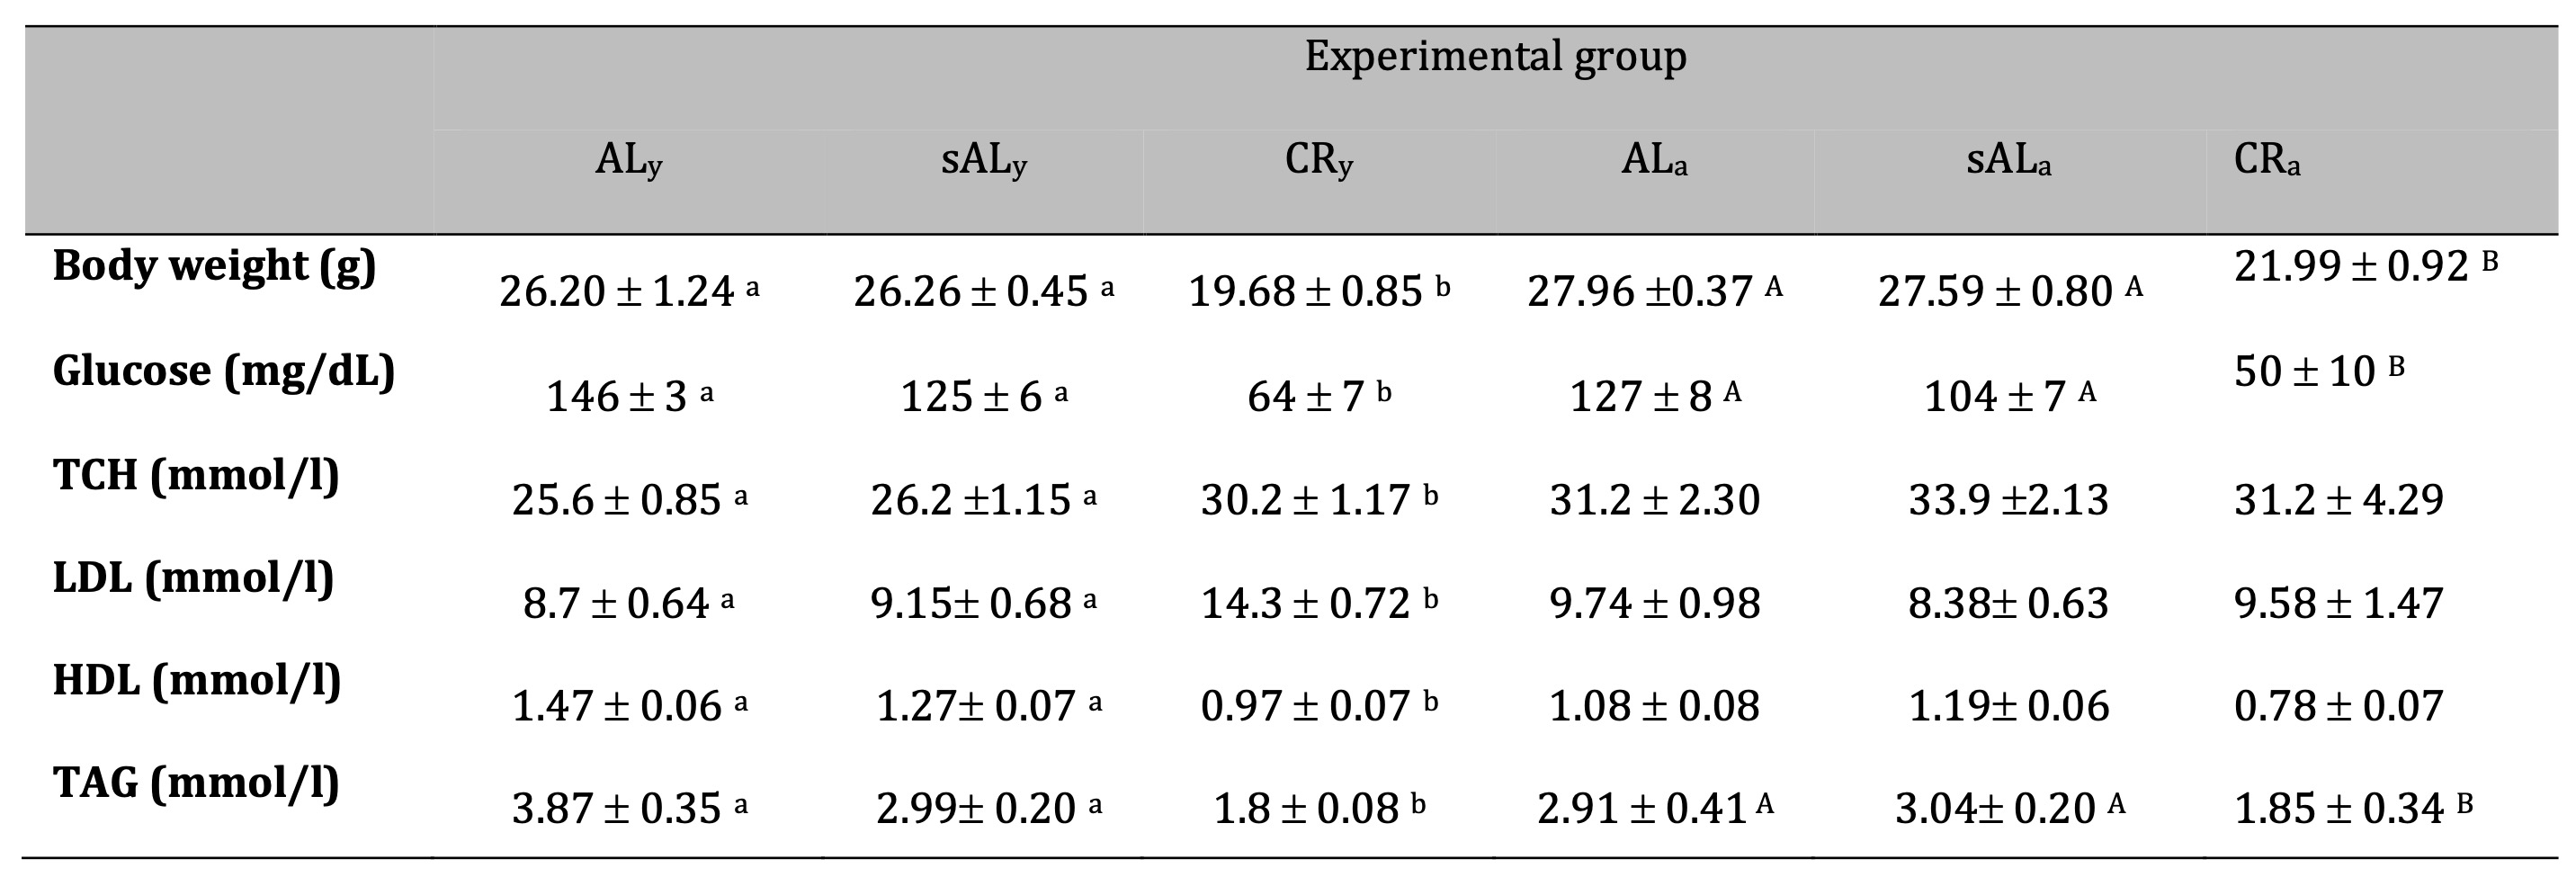
Table 2: Effect CR diet on ApoE/LDLr-/- mice in different age (SEM) (p < 0.05. a.b young animals. A.Badult animals)
Effect of CR on blood glucose concentration
Caloric restriction significantly reduced blood glucose concentrations in both young and adult mice, with decreases of 56% and 61%, respectively, compared to the control group.
Effect of CR on Lipid Profile in Plasma
Caloric restriction significantly altered the plasma lipid profile (Table 2). In young animals, adverse changes in cholesterol levels were observed, with LDL cholesterol increasing by 64% in the CR group, while HDL cholesterol decreased by 35%. In contrast, total cholesterol (TCh) and LDL cholesterol levels remained unchanged in adult animals. Triglyceride (TAG) levels were significantly reduced in both young and adult mice following CR treatment.
As there were no significant differences in body weight or plasma lipid parameters between the AL and sAL groups, indicating that individual housing had no effect, only the AL (control) and CR groups were selected for atherosclerotic lesion analysis, microarray analysis, and microbiota assessment.
Effect of CR on Atherosclerosis
owing CR treatment, the extent of atherosclerosis, as measured in the entire aorta (en face analysis), was significantly altered in both young and adult mice compared to the control group (Table 3). In young animals, CR significantly increased atherosclerotic plaque formation (Fig. 1). Conversely, in adult ApoE/LDLr-/- mice, CR treatment led to a reduction in atherosclerotic plaques (Fig. 2). Plaque area in the aortic roots (cross-section analysis) did not differ significantly between experimental groups (Table 3). However, in young CR-fed ApoE/LDLr-/- mice, plaque area tended to be higher than in controls, with an approximately 60% increase (492, 644 vs. 798, 067 µm², respectively). In contrast, adult CR-fed mice exhibited a 15% reduction in aortic root atherosclerosis compared to controls.
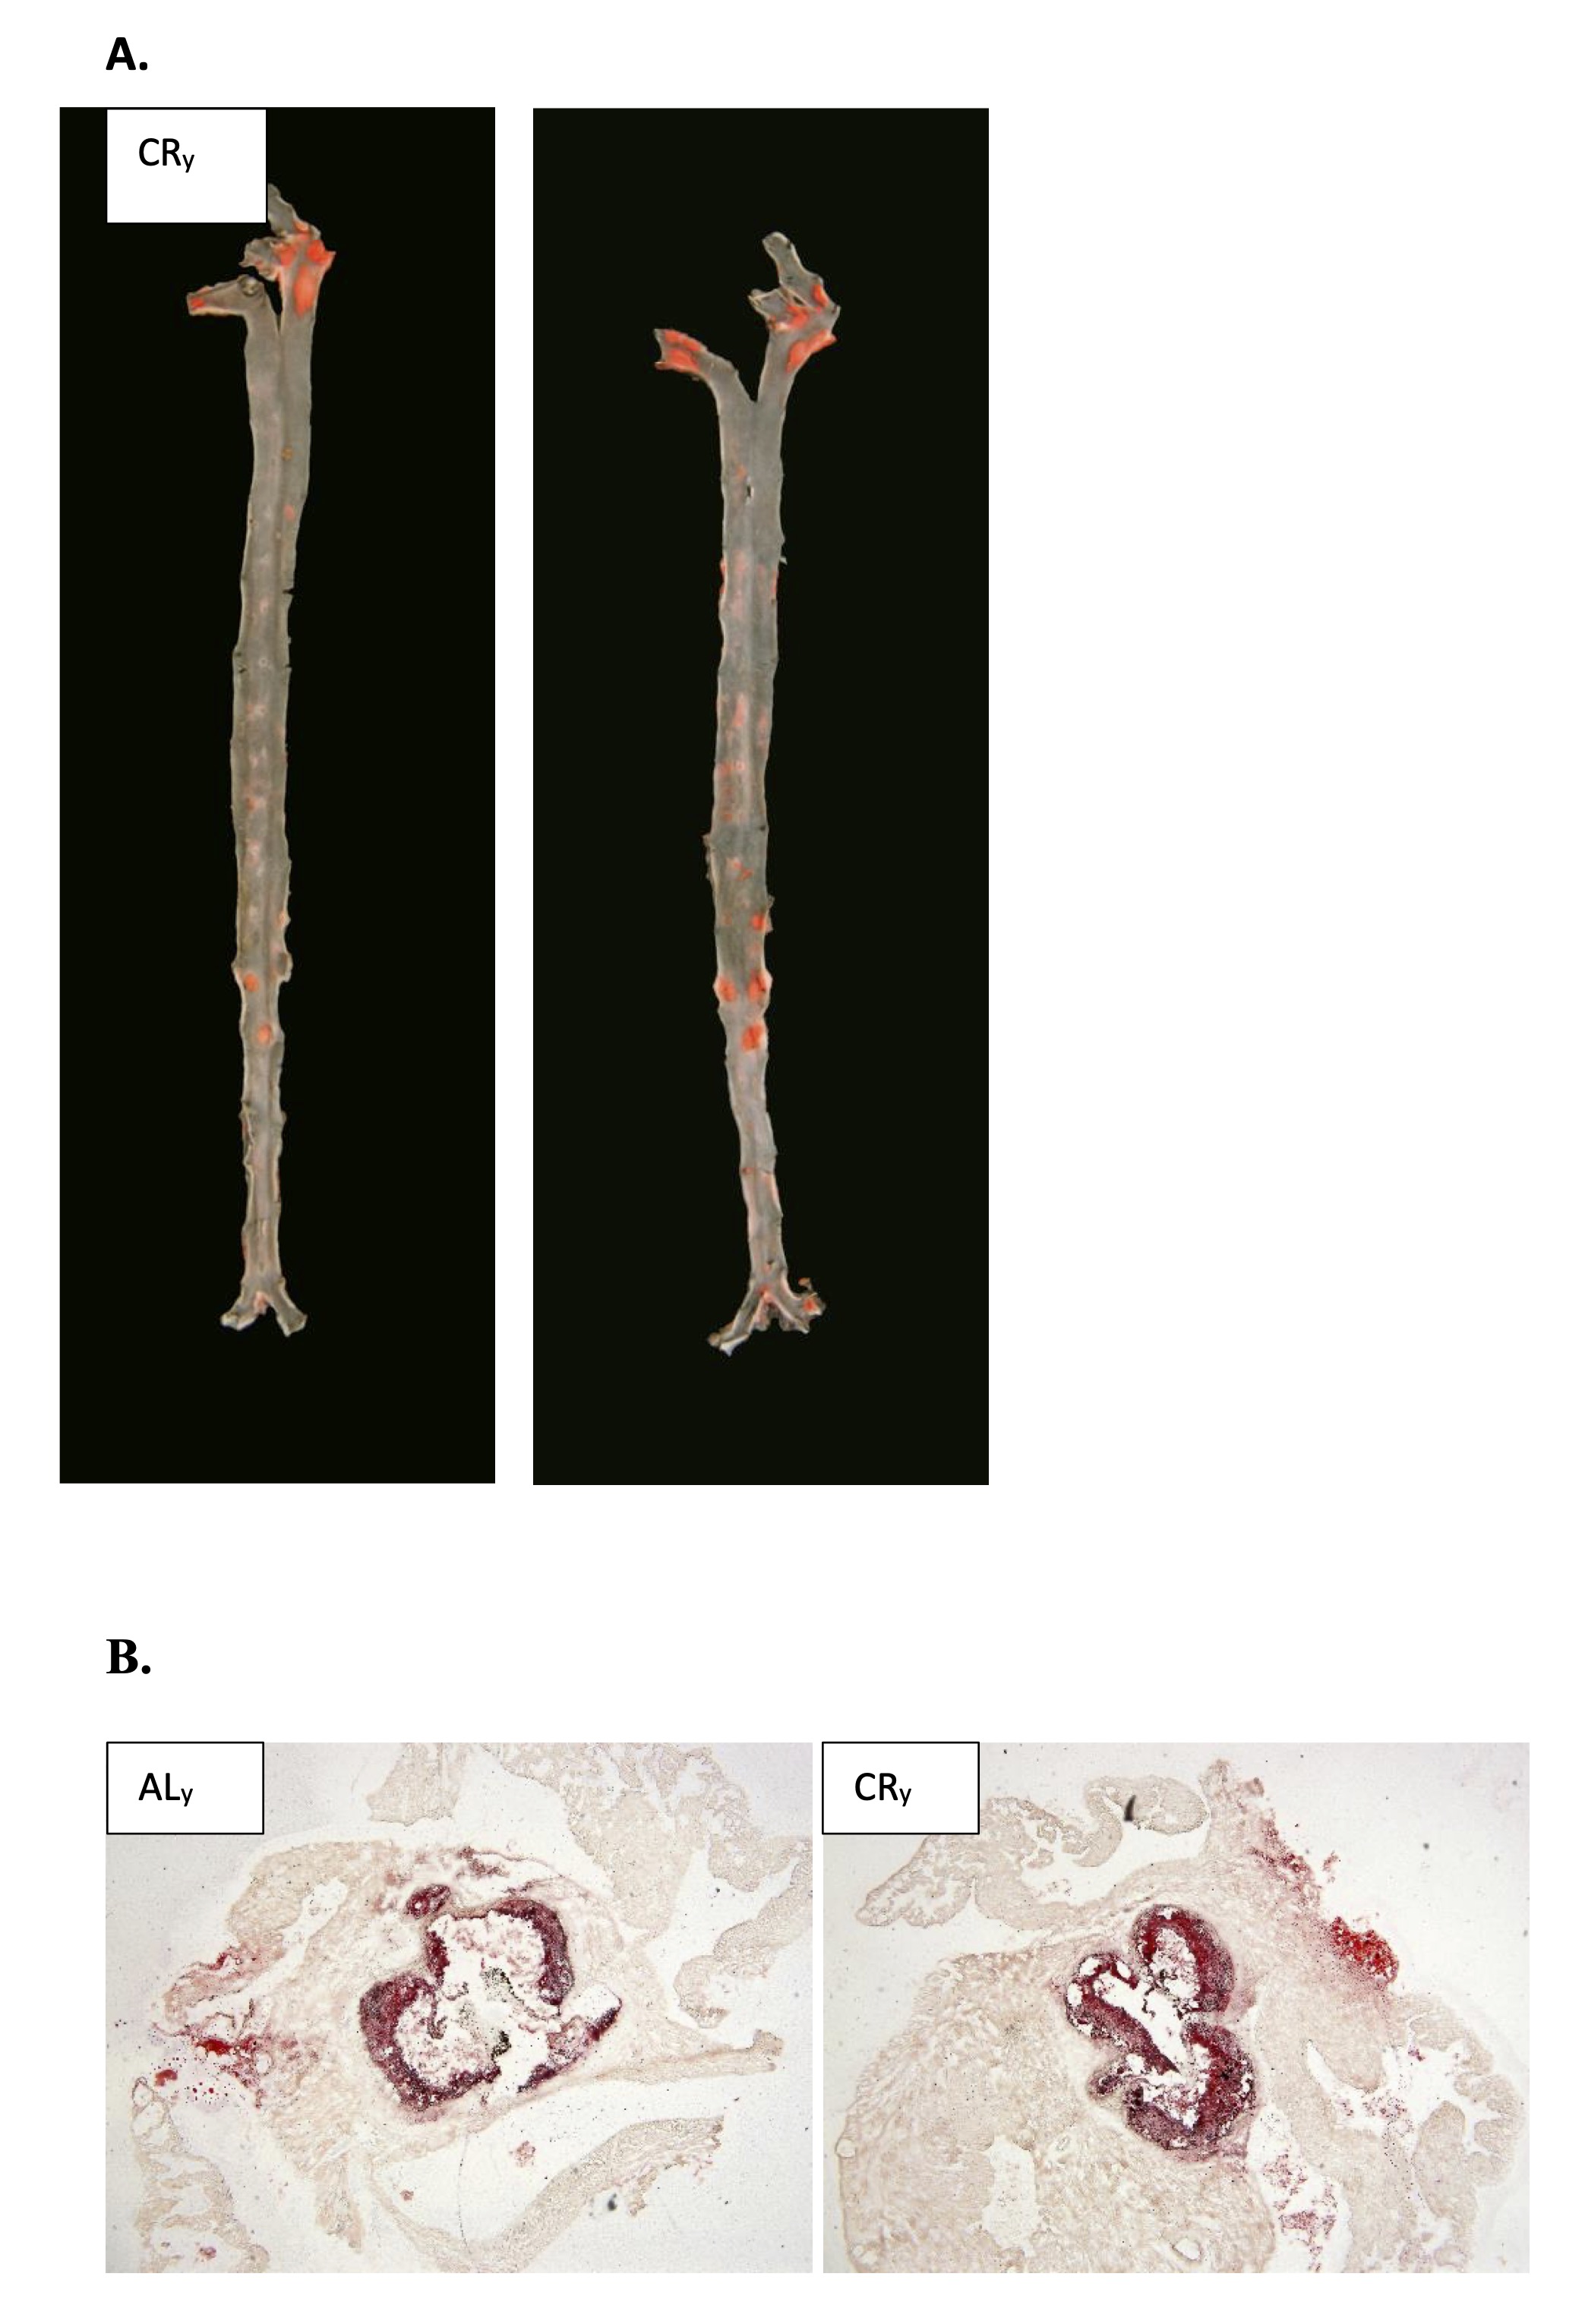
Fig. 1: Representative images of en face aorta stained by Sudan IV (A) and cross-sections of aortic roots stained by ORO (B) showing atherosclerotic plaque in ApoE/LDLr-/- young mice fed control (ALy) (a, c) and calorie restriction (CRy) (b, d) diet.
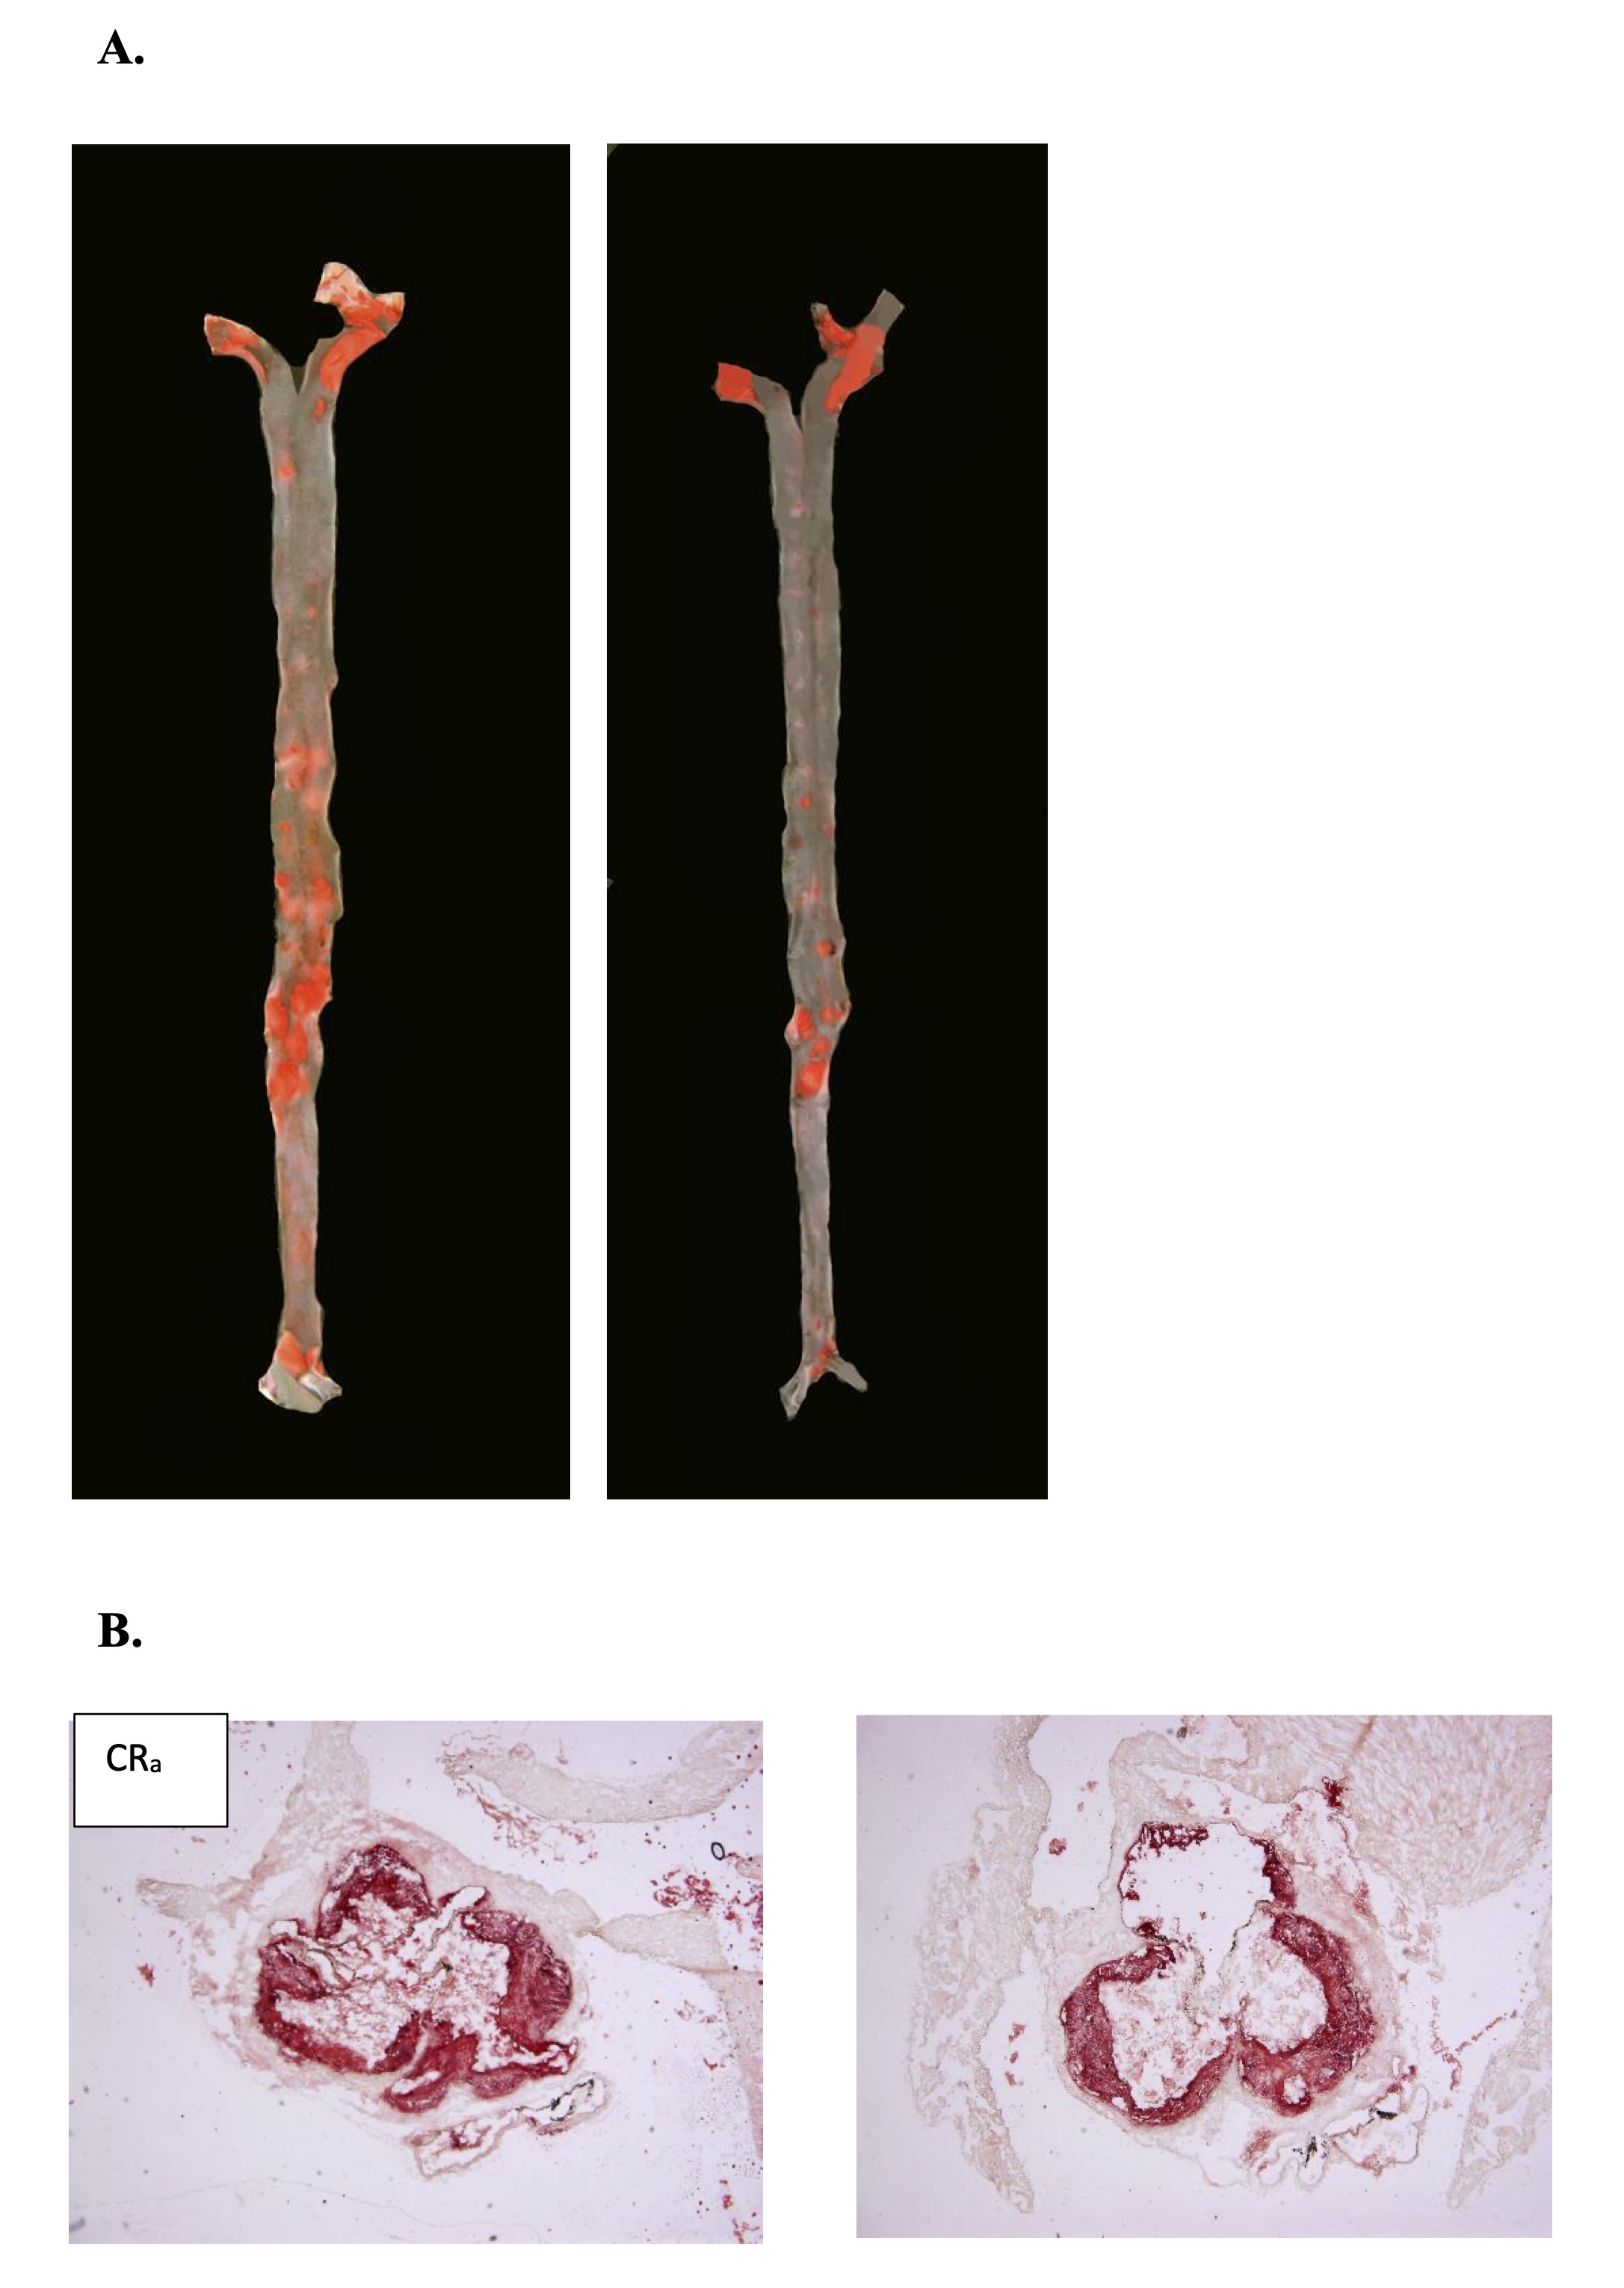
Fig. 2: Representative images of en face aorta stained by Sudan IV (A) and cross-sections of aortic roots stained by ORO (B) showing atherosclerotic plaque in ApoE/LDLr-/- adult mice fed control (ALa) (a, c) and calorie restriction (CRa) (b, d) diet.
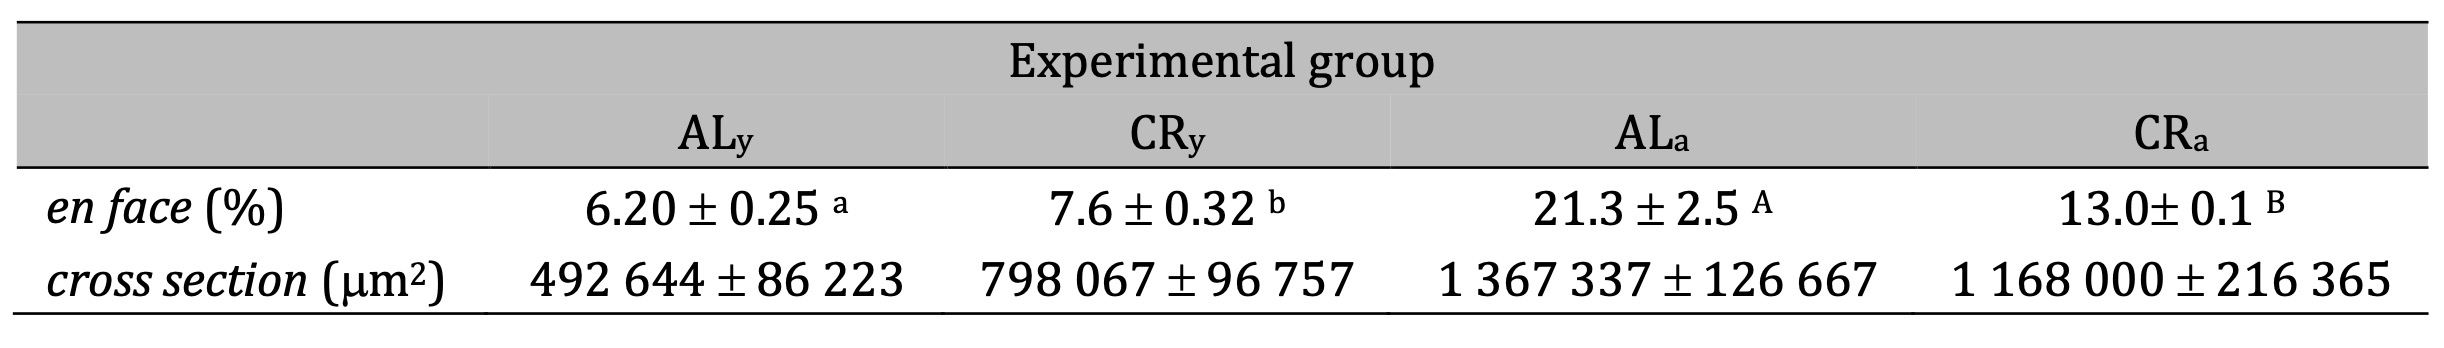
Table 3: Effect CR diet on ApoE/LDLr-/- mice in different age (SEM) (p < 0.05. a.b young animals. A.B adult animals)
Effect of CR on Liver Gene Expression Profiling
Liver transcriptome analysis was performed using liver’s RNA from control and CR young mice. The results from the microarray analysis are shown in Table 4 and Table 5 and Supplementary File 2. In total, 213 transcripts, corresponding to 171 different genes were differentially expressed with FDR<0.05 in the liver of CR mice as compared to control mice. Among these genes, 94 were upregulated and 119 were downregulated (Fig. 3). The expression levels of seven genes [flavin-containing monooxygenase 3; cytochrome P450, family 4, subfamily a, polypeptide 14; leptin receptor; pyruvate dehydrogenase kinase, isoenzyme 4; cytochrome P450, family 39, subfamily a, polypeptide 1; acyl-CoA thioesterase] were > 20-fold higher in CR than in control mice, with the level of flavin-containing monooxygenase 3 showing a > 400-fold difference. Flavin-containing the monooxygenase 3 gene has been upregulated in CR animals. The expression of six genes [adhesion G protein-coupled receptor F1; dickkopf WNT signaling pathway inhibitor 4; major urinary protein 17; LIM homeobox protein 9; serine (or cysteine) peptidase inhibitor, clade A; vomeronasal 1 receptor 214; nudix (nucleoside diphosphate linked moiety X)-type motif 7] were decreased by > 12-fold in CR as compared to control mice.
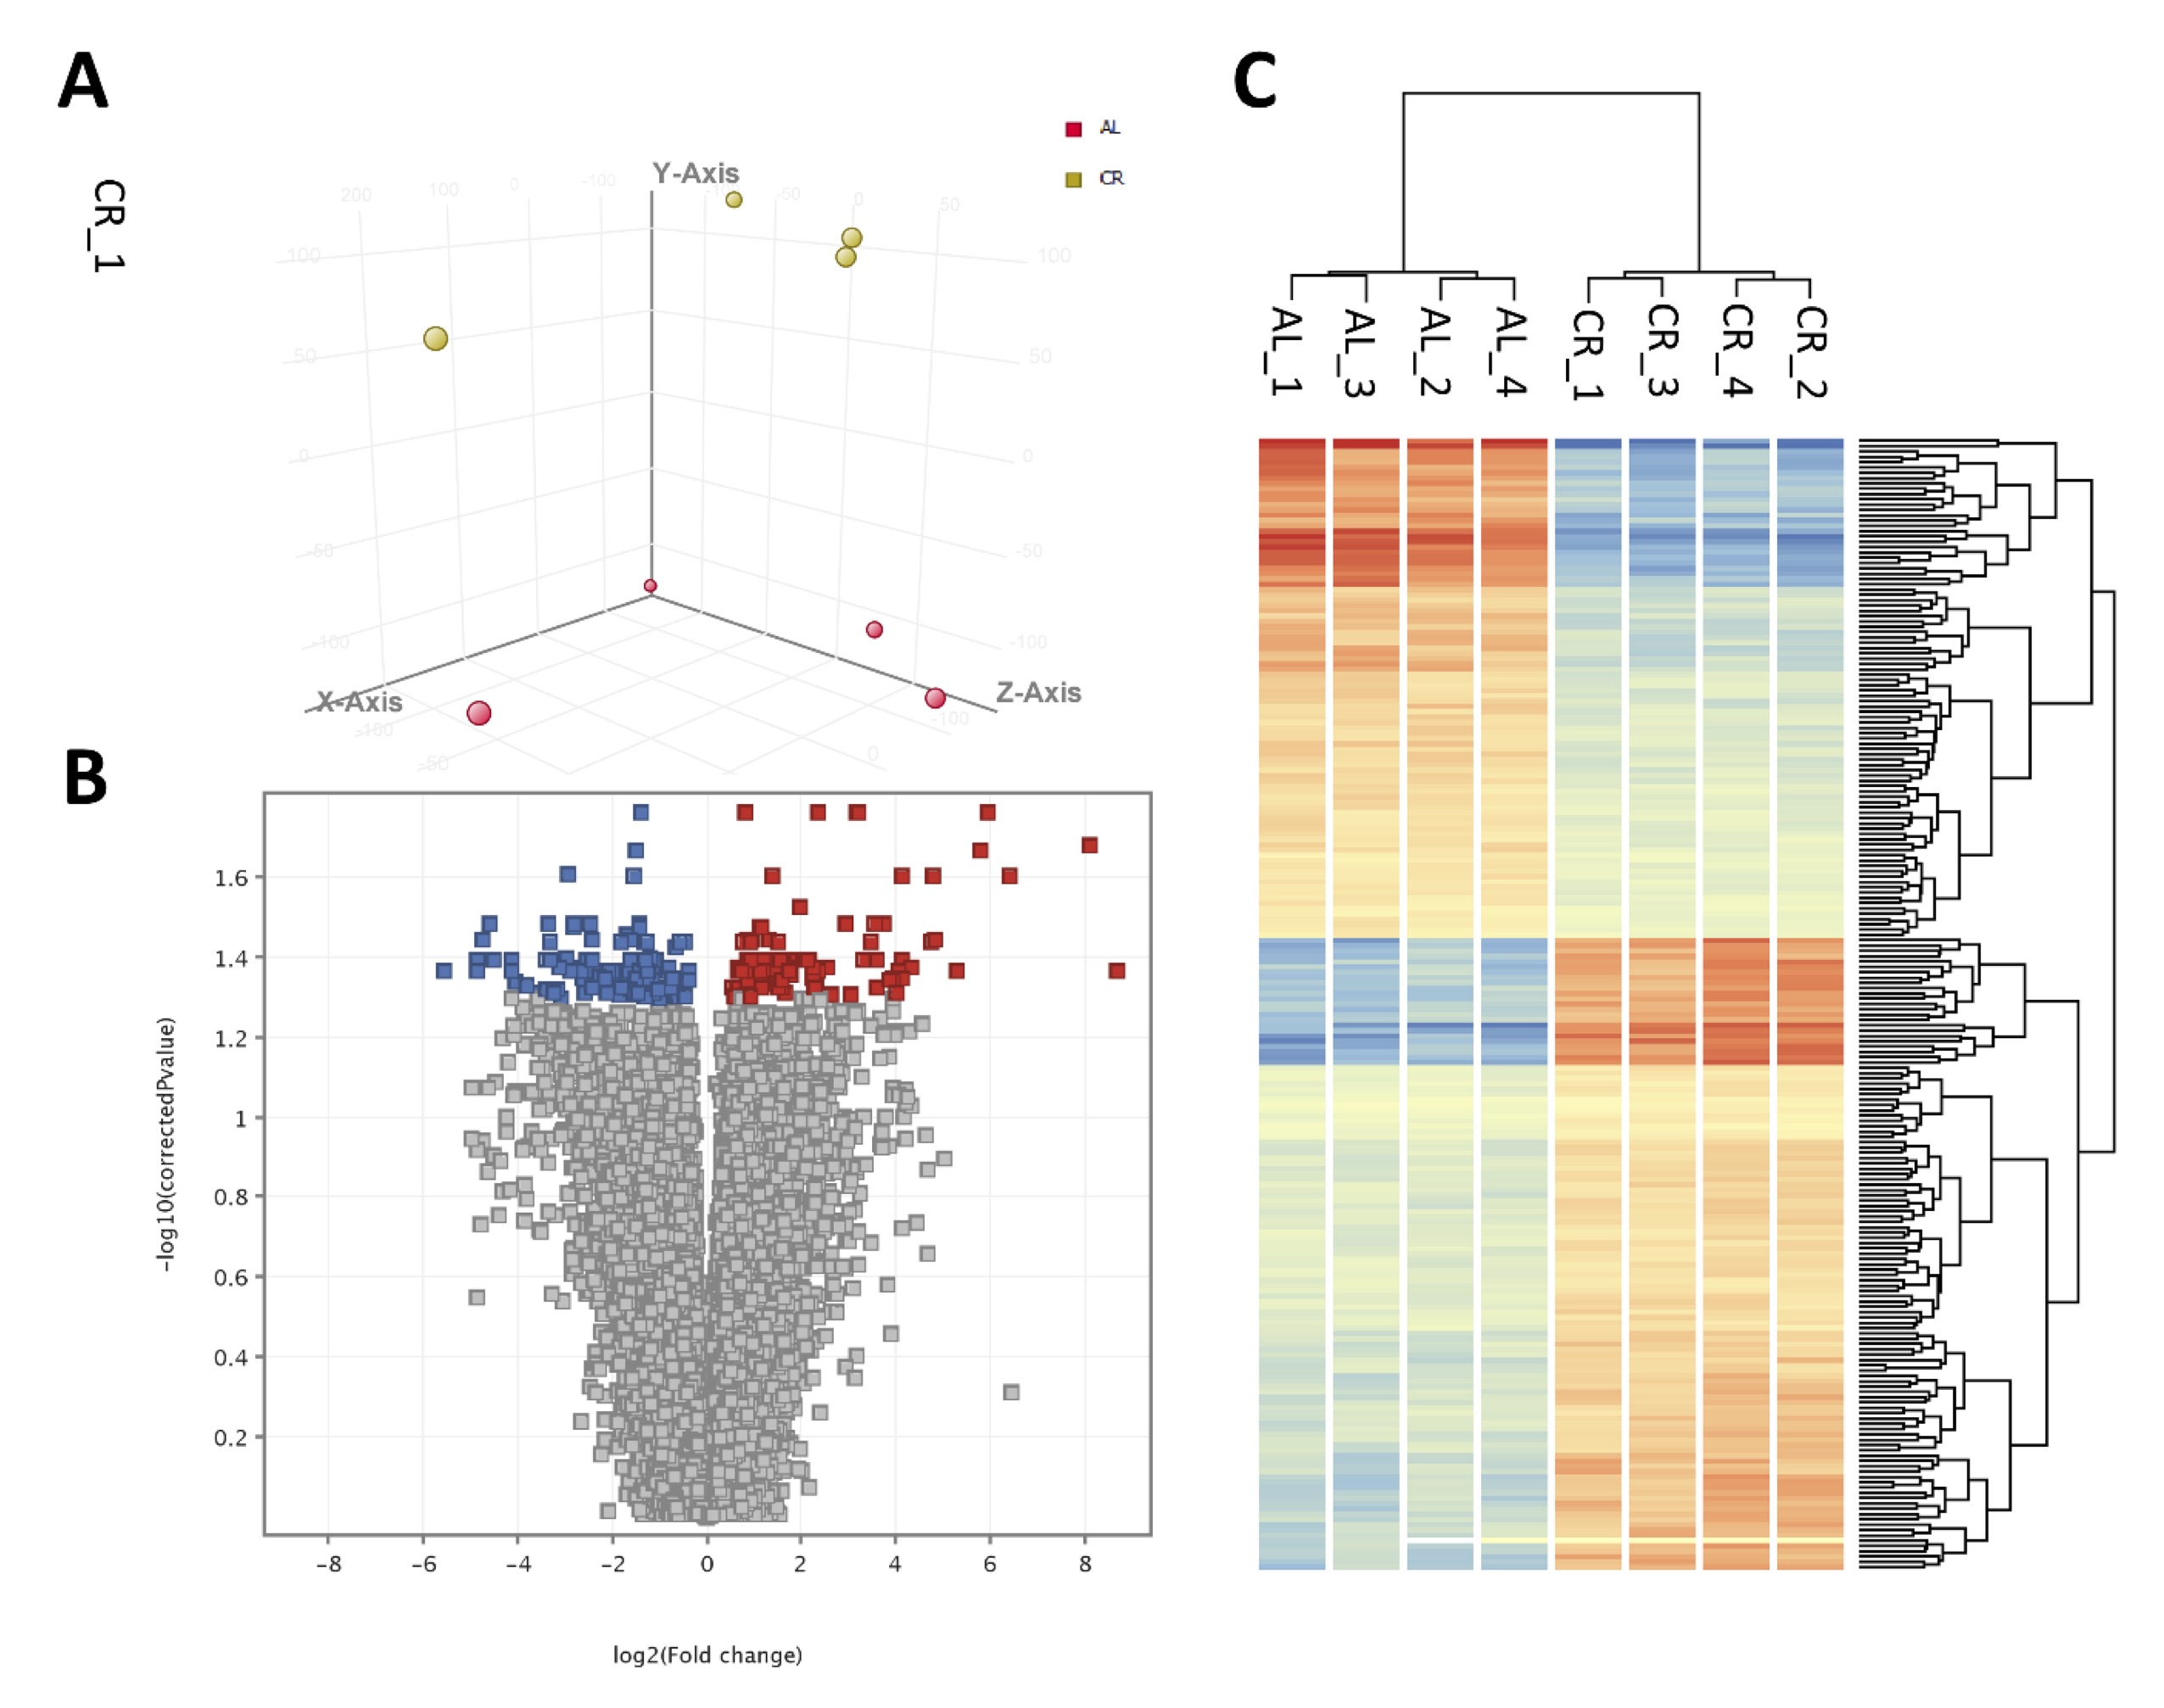
Fig. 3: Results of gene expression profile analysis in AL and CR mice liver. A. Principal components analysis (PCA); B. Volcano plot for differences between AL and CR groups; C. Heatmap and hierarchical clustering of genes and samples based on differtialy expressed genes.
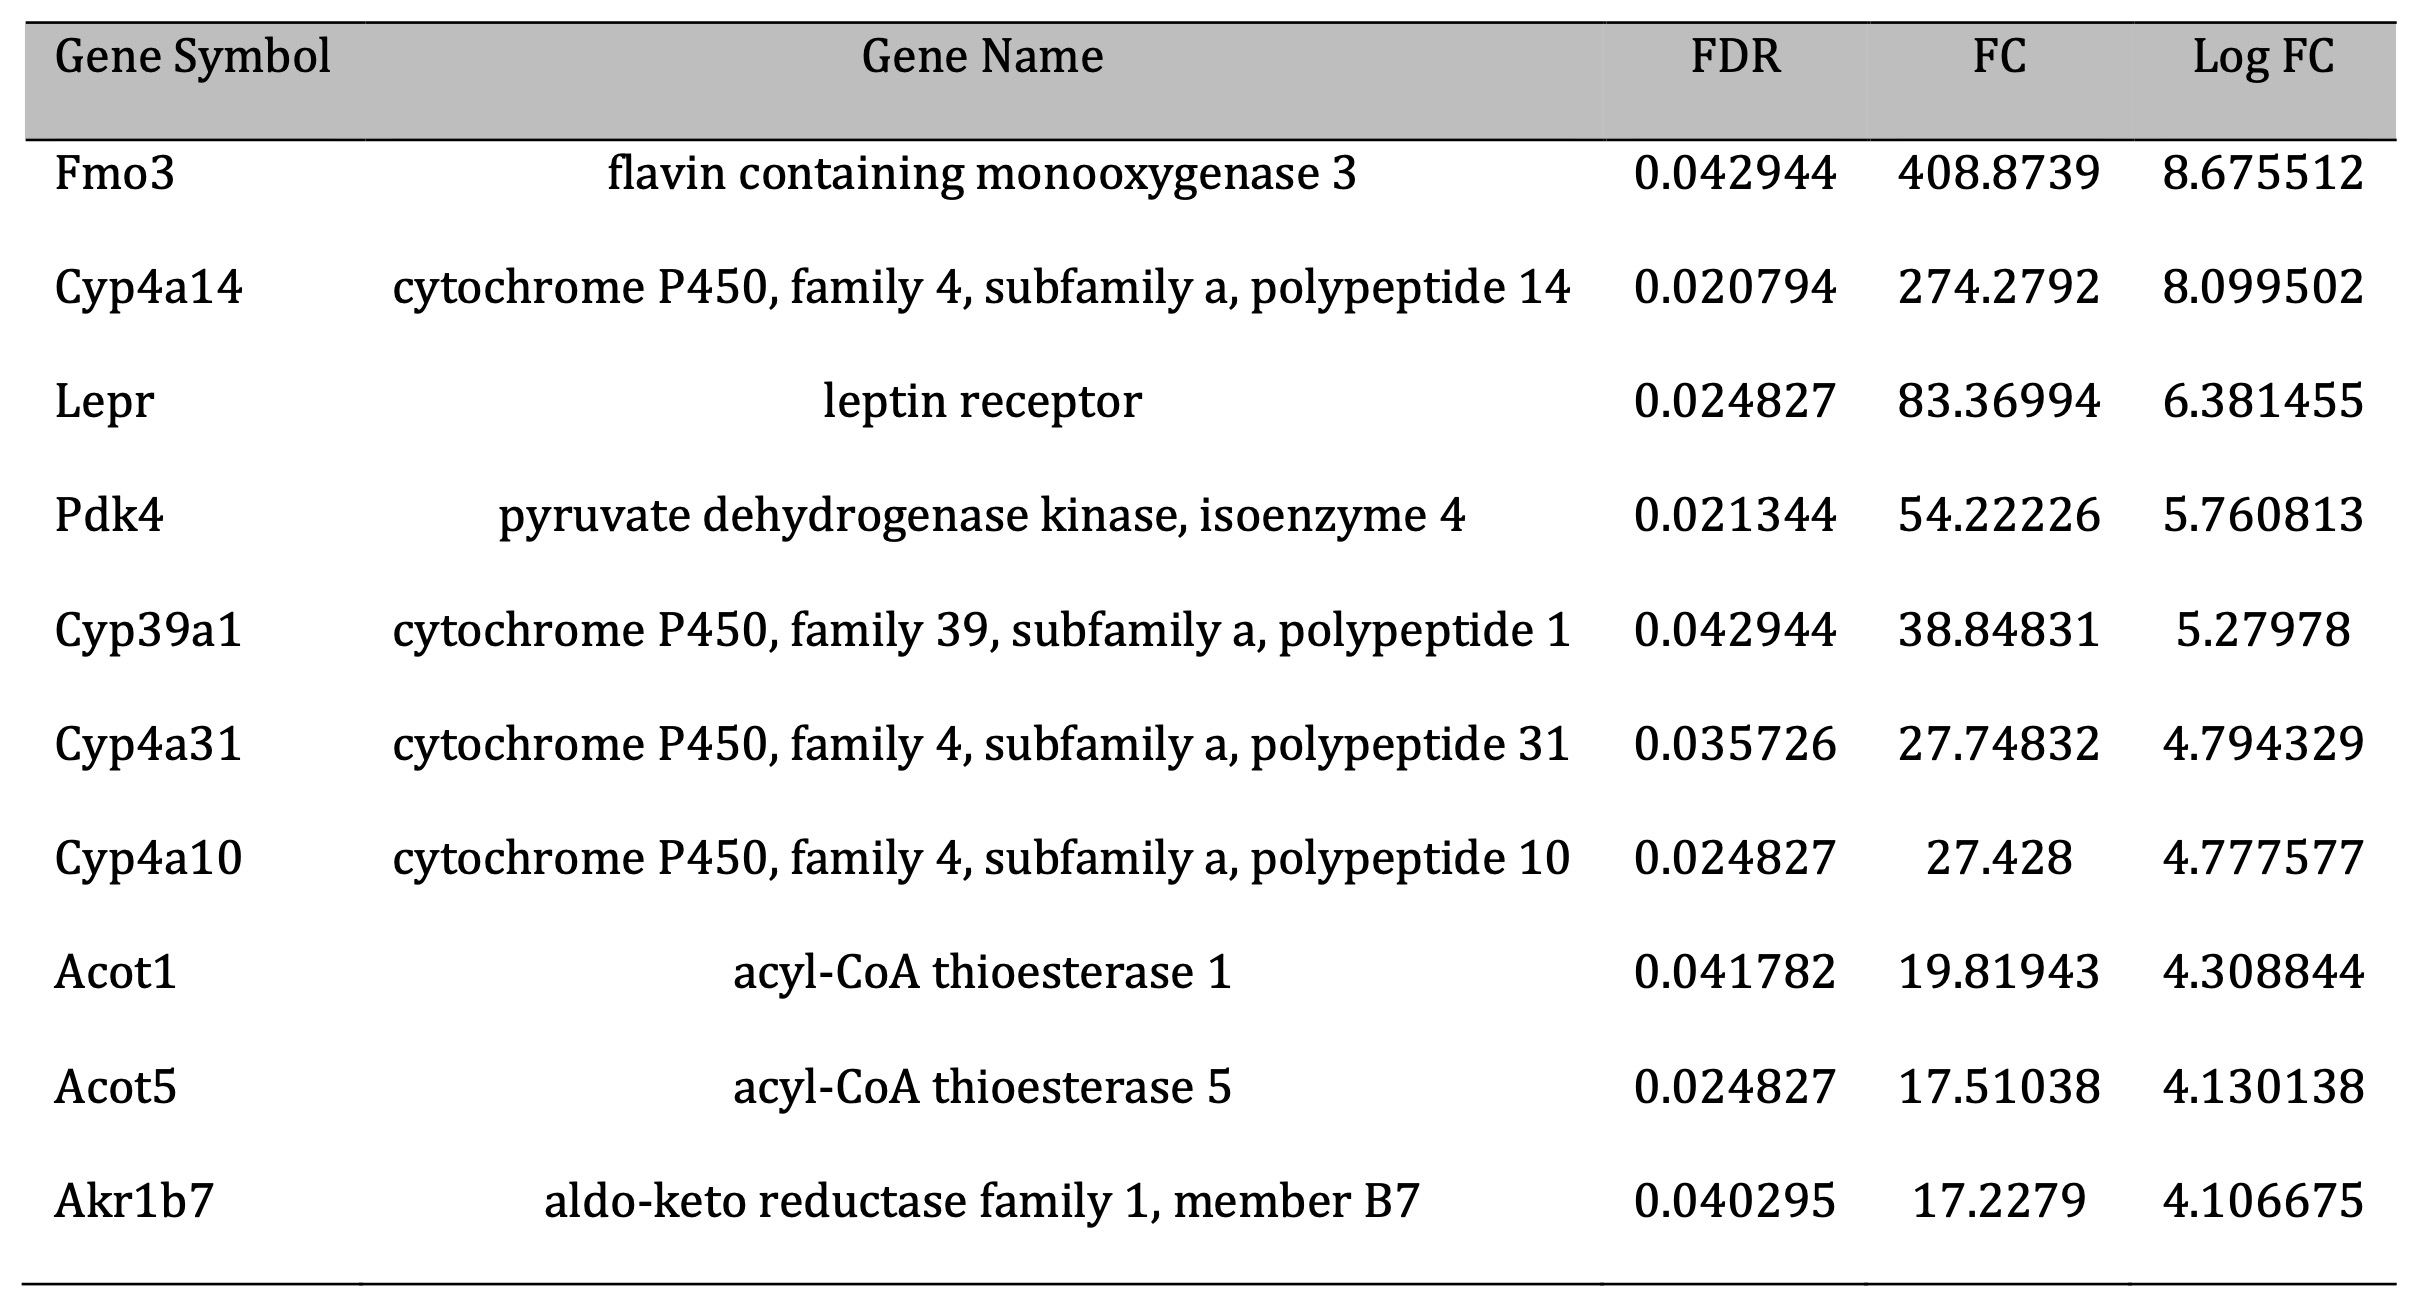
Table 4: Top 10 genes differentially expressed (considering fold change) in the liver of control and CR young mice (upregulation). FDR- faske discovery rate; FC – fold chcnge; Log FC – log2 fold chcnge
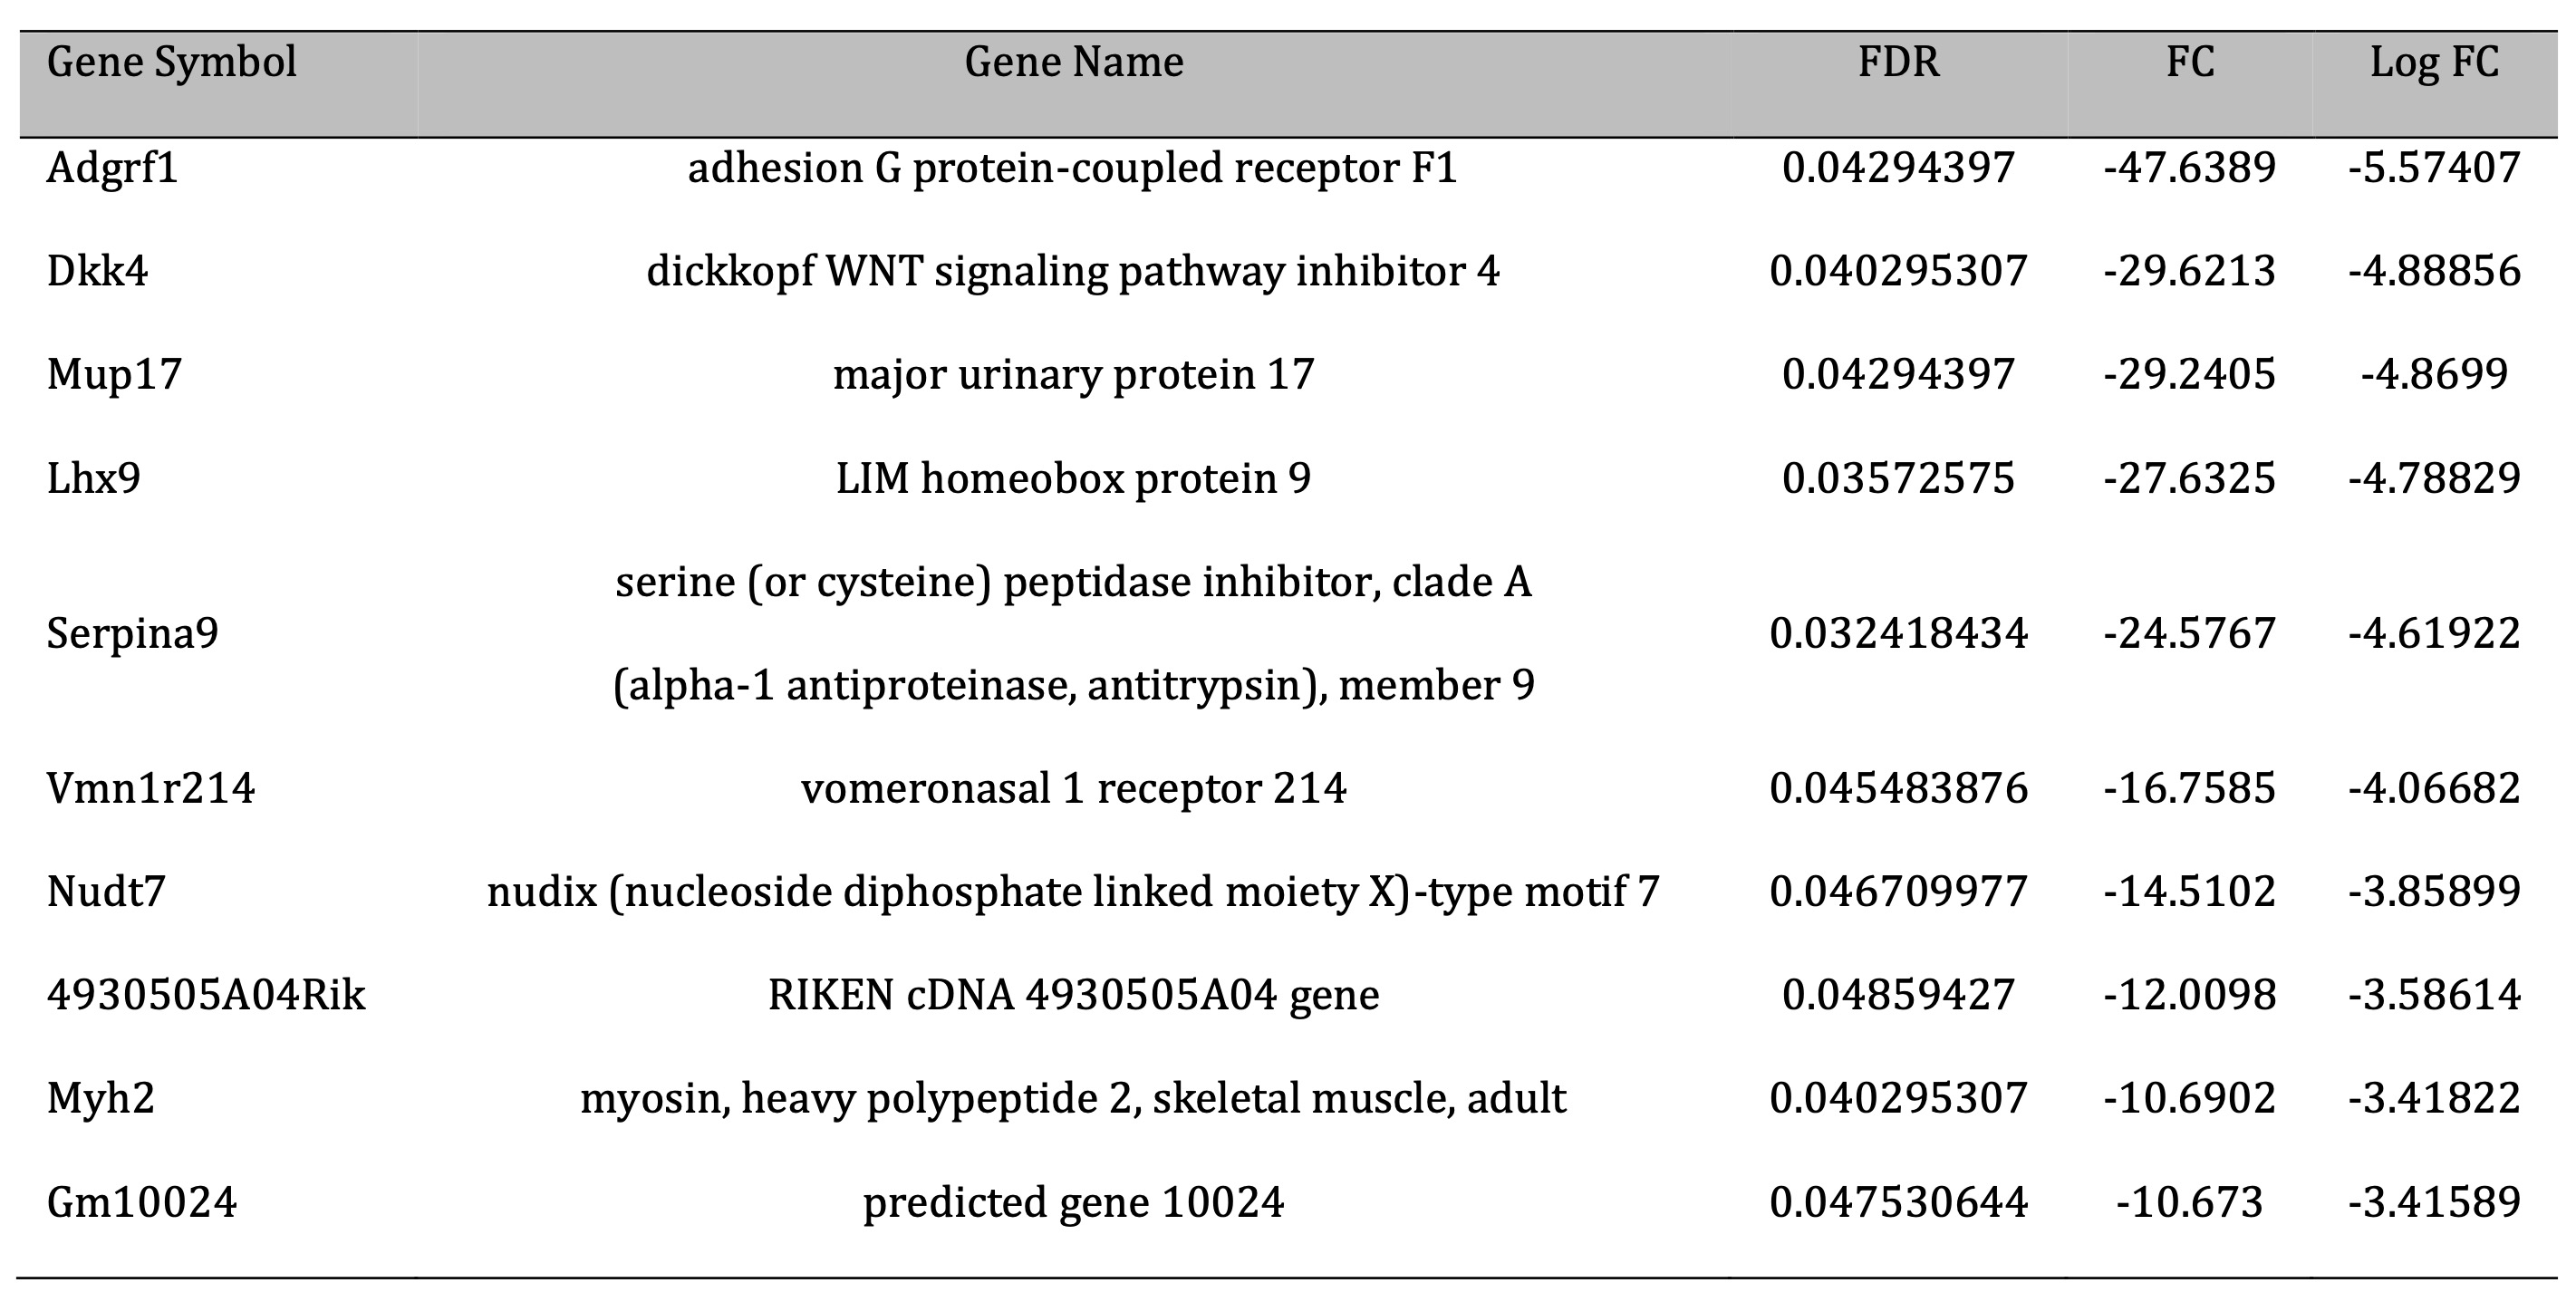
Table 5: Top ten genes differentially expressed (considering fold chcnge) in the liver of control and CR young mice (downregulation). FDR- faske discovery rate; FC – fold chcnge; Log FC – log2 fold chcnge
Microbiome Characteristics and Differential Abundance Analysis
For the analyzed samples, between 67.8 and 116.7 million (M) paired-end reads were generated, with an average of 92.4 M reads. On average, 48.6% of reads passed strict filtering using DADA2, and 46.8% of read pairs were successfully merged (Supplementary File 3). The refraction curve analysis (Fig. 4) indicated that sequencing depth approached saturation at approximately 3, 000 reads. Therefore, this threshold was used for alpha and beta diversity analyses.
Alpha diversity parameters did not significantly differ among study groups; however, higher level of indexes variation was observed in the CR group. The number of identified unique features (i.e., merged and denoised reads) ranged from 78 to 174 in individual samples, with an average of 124. The mean Shannon index was 5.47, the mean Faith phylogenic diversity index was 8.29, and the mean Pielou evenness index was 0.79 across all samples (Fig. 4; Table 6).
Beta diversity analysis revealed significant differences in microbiota composition among groups. Jaccard distance analysis showed significant group differences (p = 0.021), indicating compositional shifts due to CR. Similar results were observed using the Bray-Curtis compositional dissimilarity index (p = 0.017), as well as both weighted (p = 0.056) and unweighted (p = 0.009) UniFrac distance metrics. Principal Coordinates Analysis (PCoA) based on UniFrac indices demonstrated distinct clustering of samples, corresponding to the analyzed groups (Fig. 5).
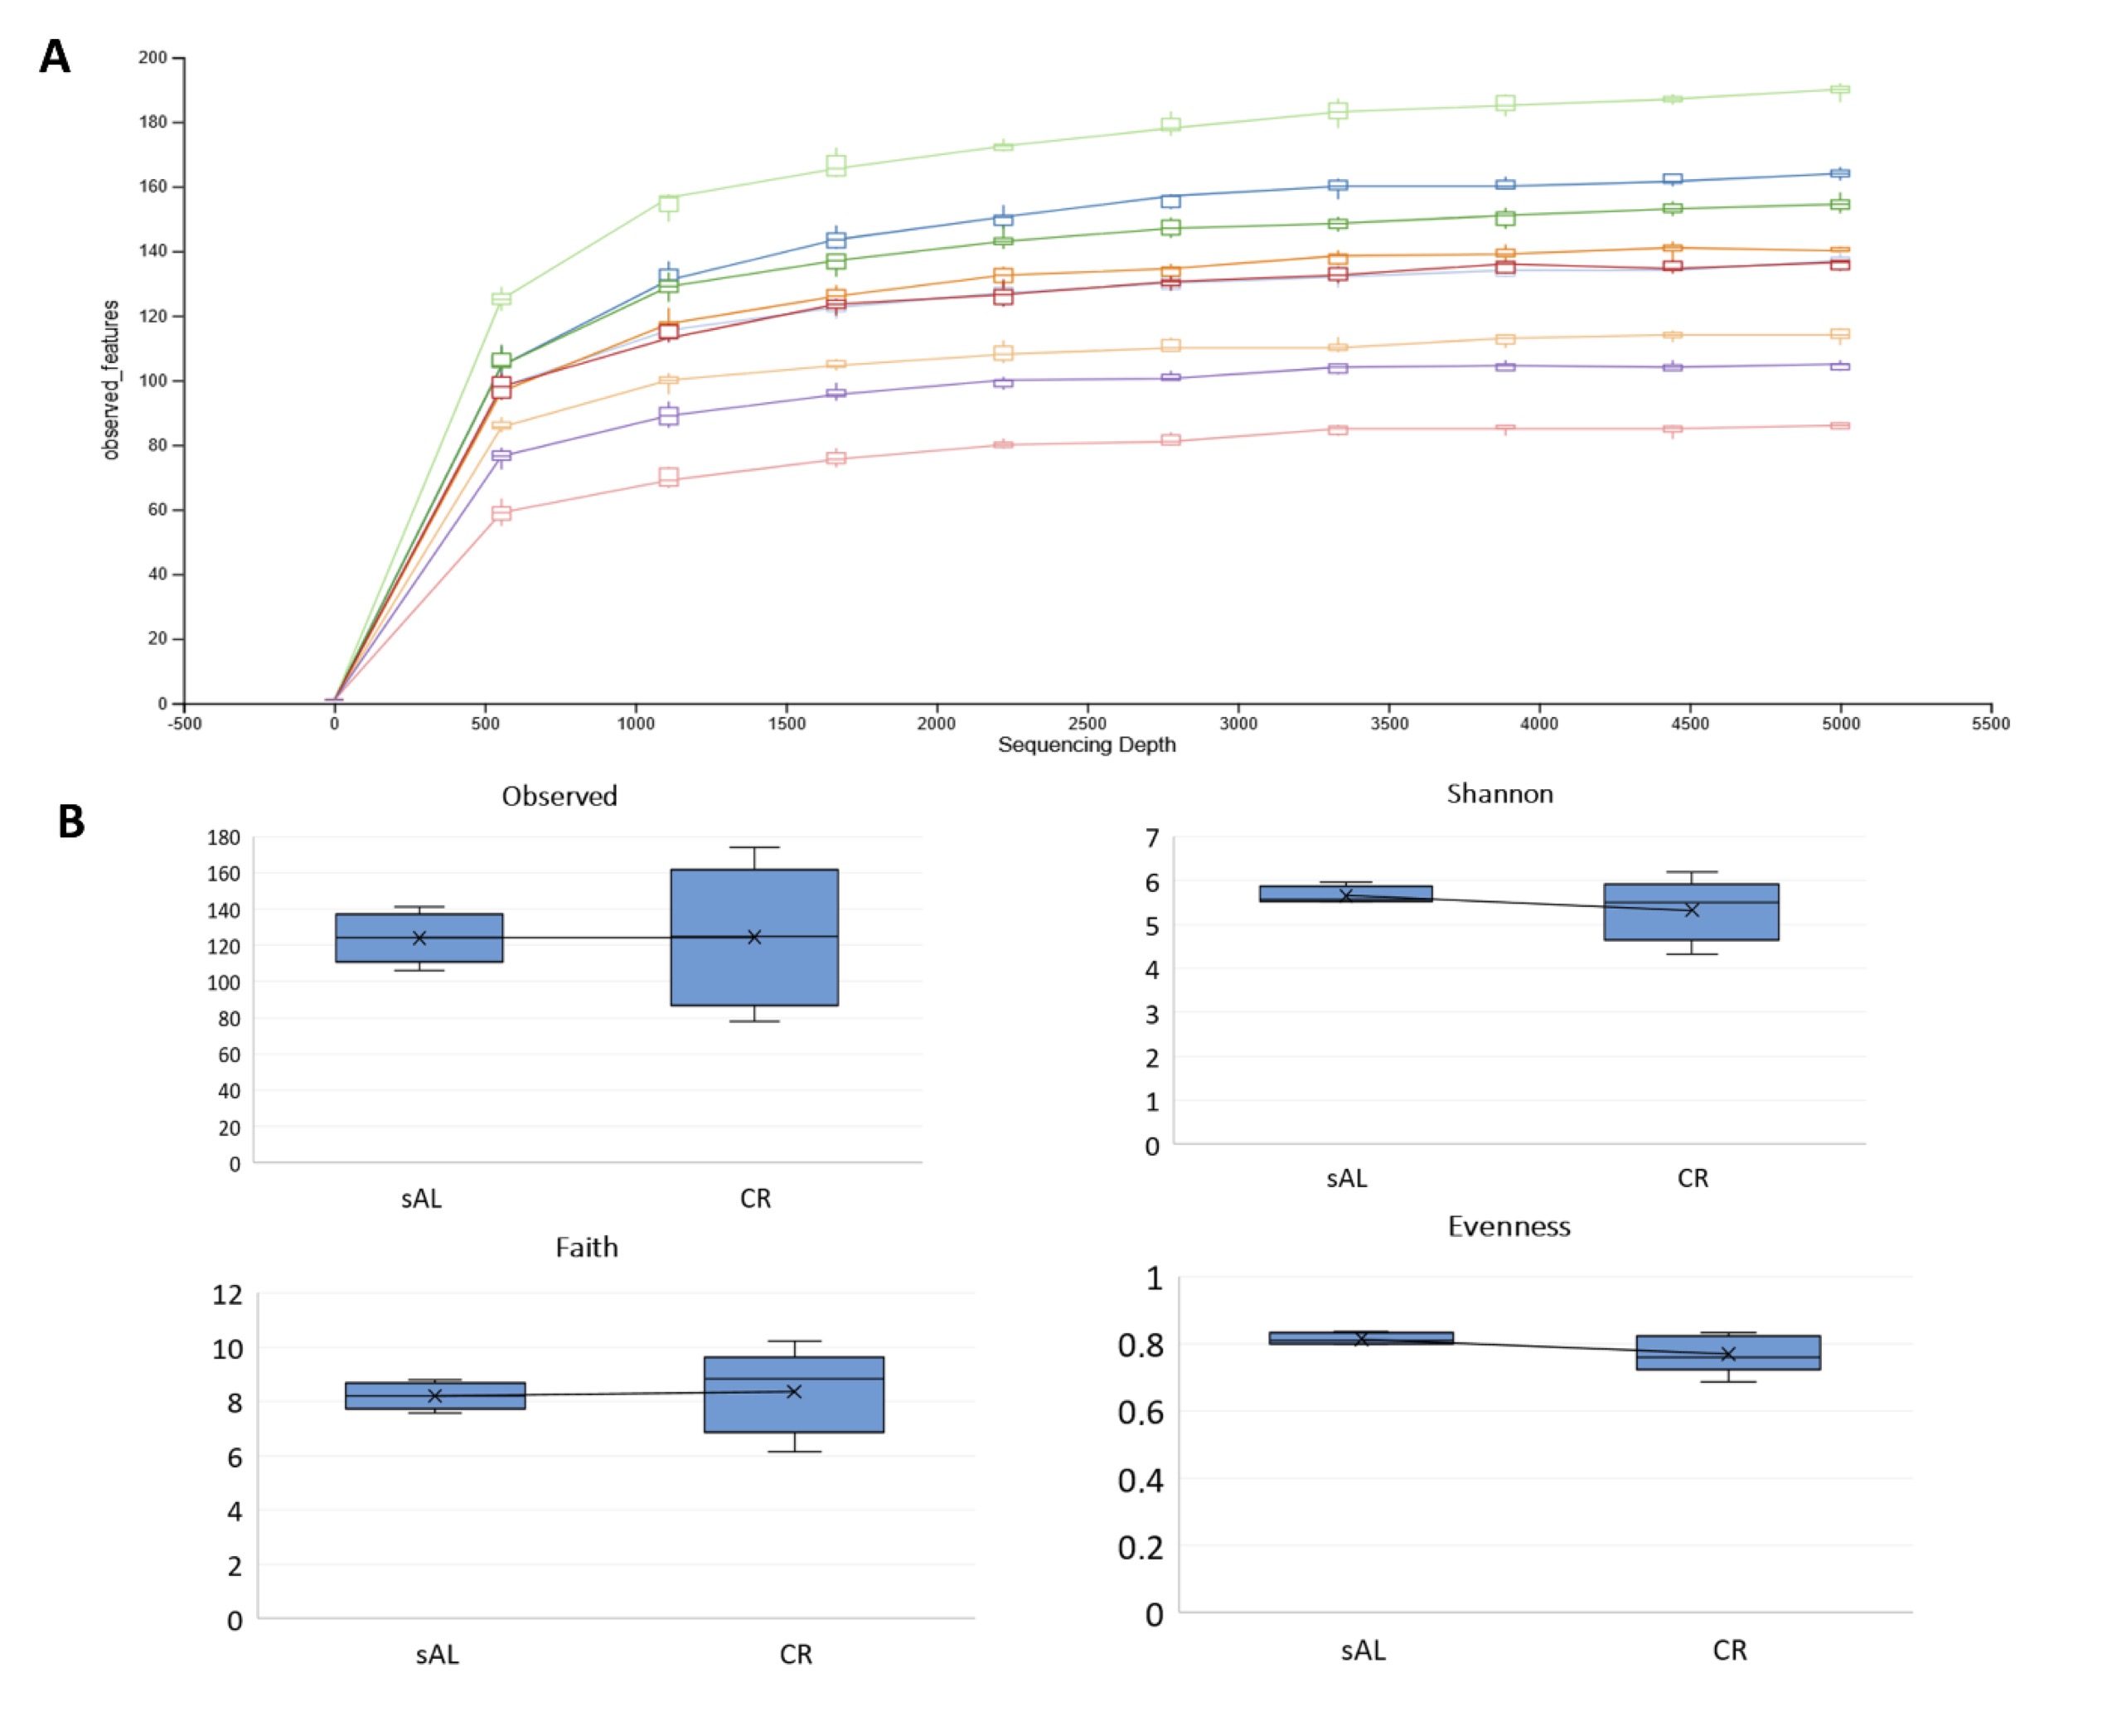
Fig. 4: Refection curve for all samples (A) and box whisker plots for alpha diversity indexes in both studied groups (B).
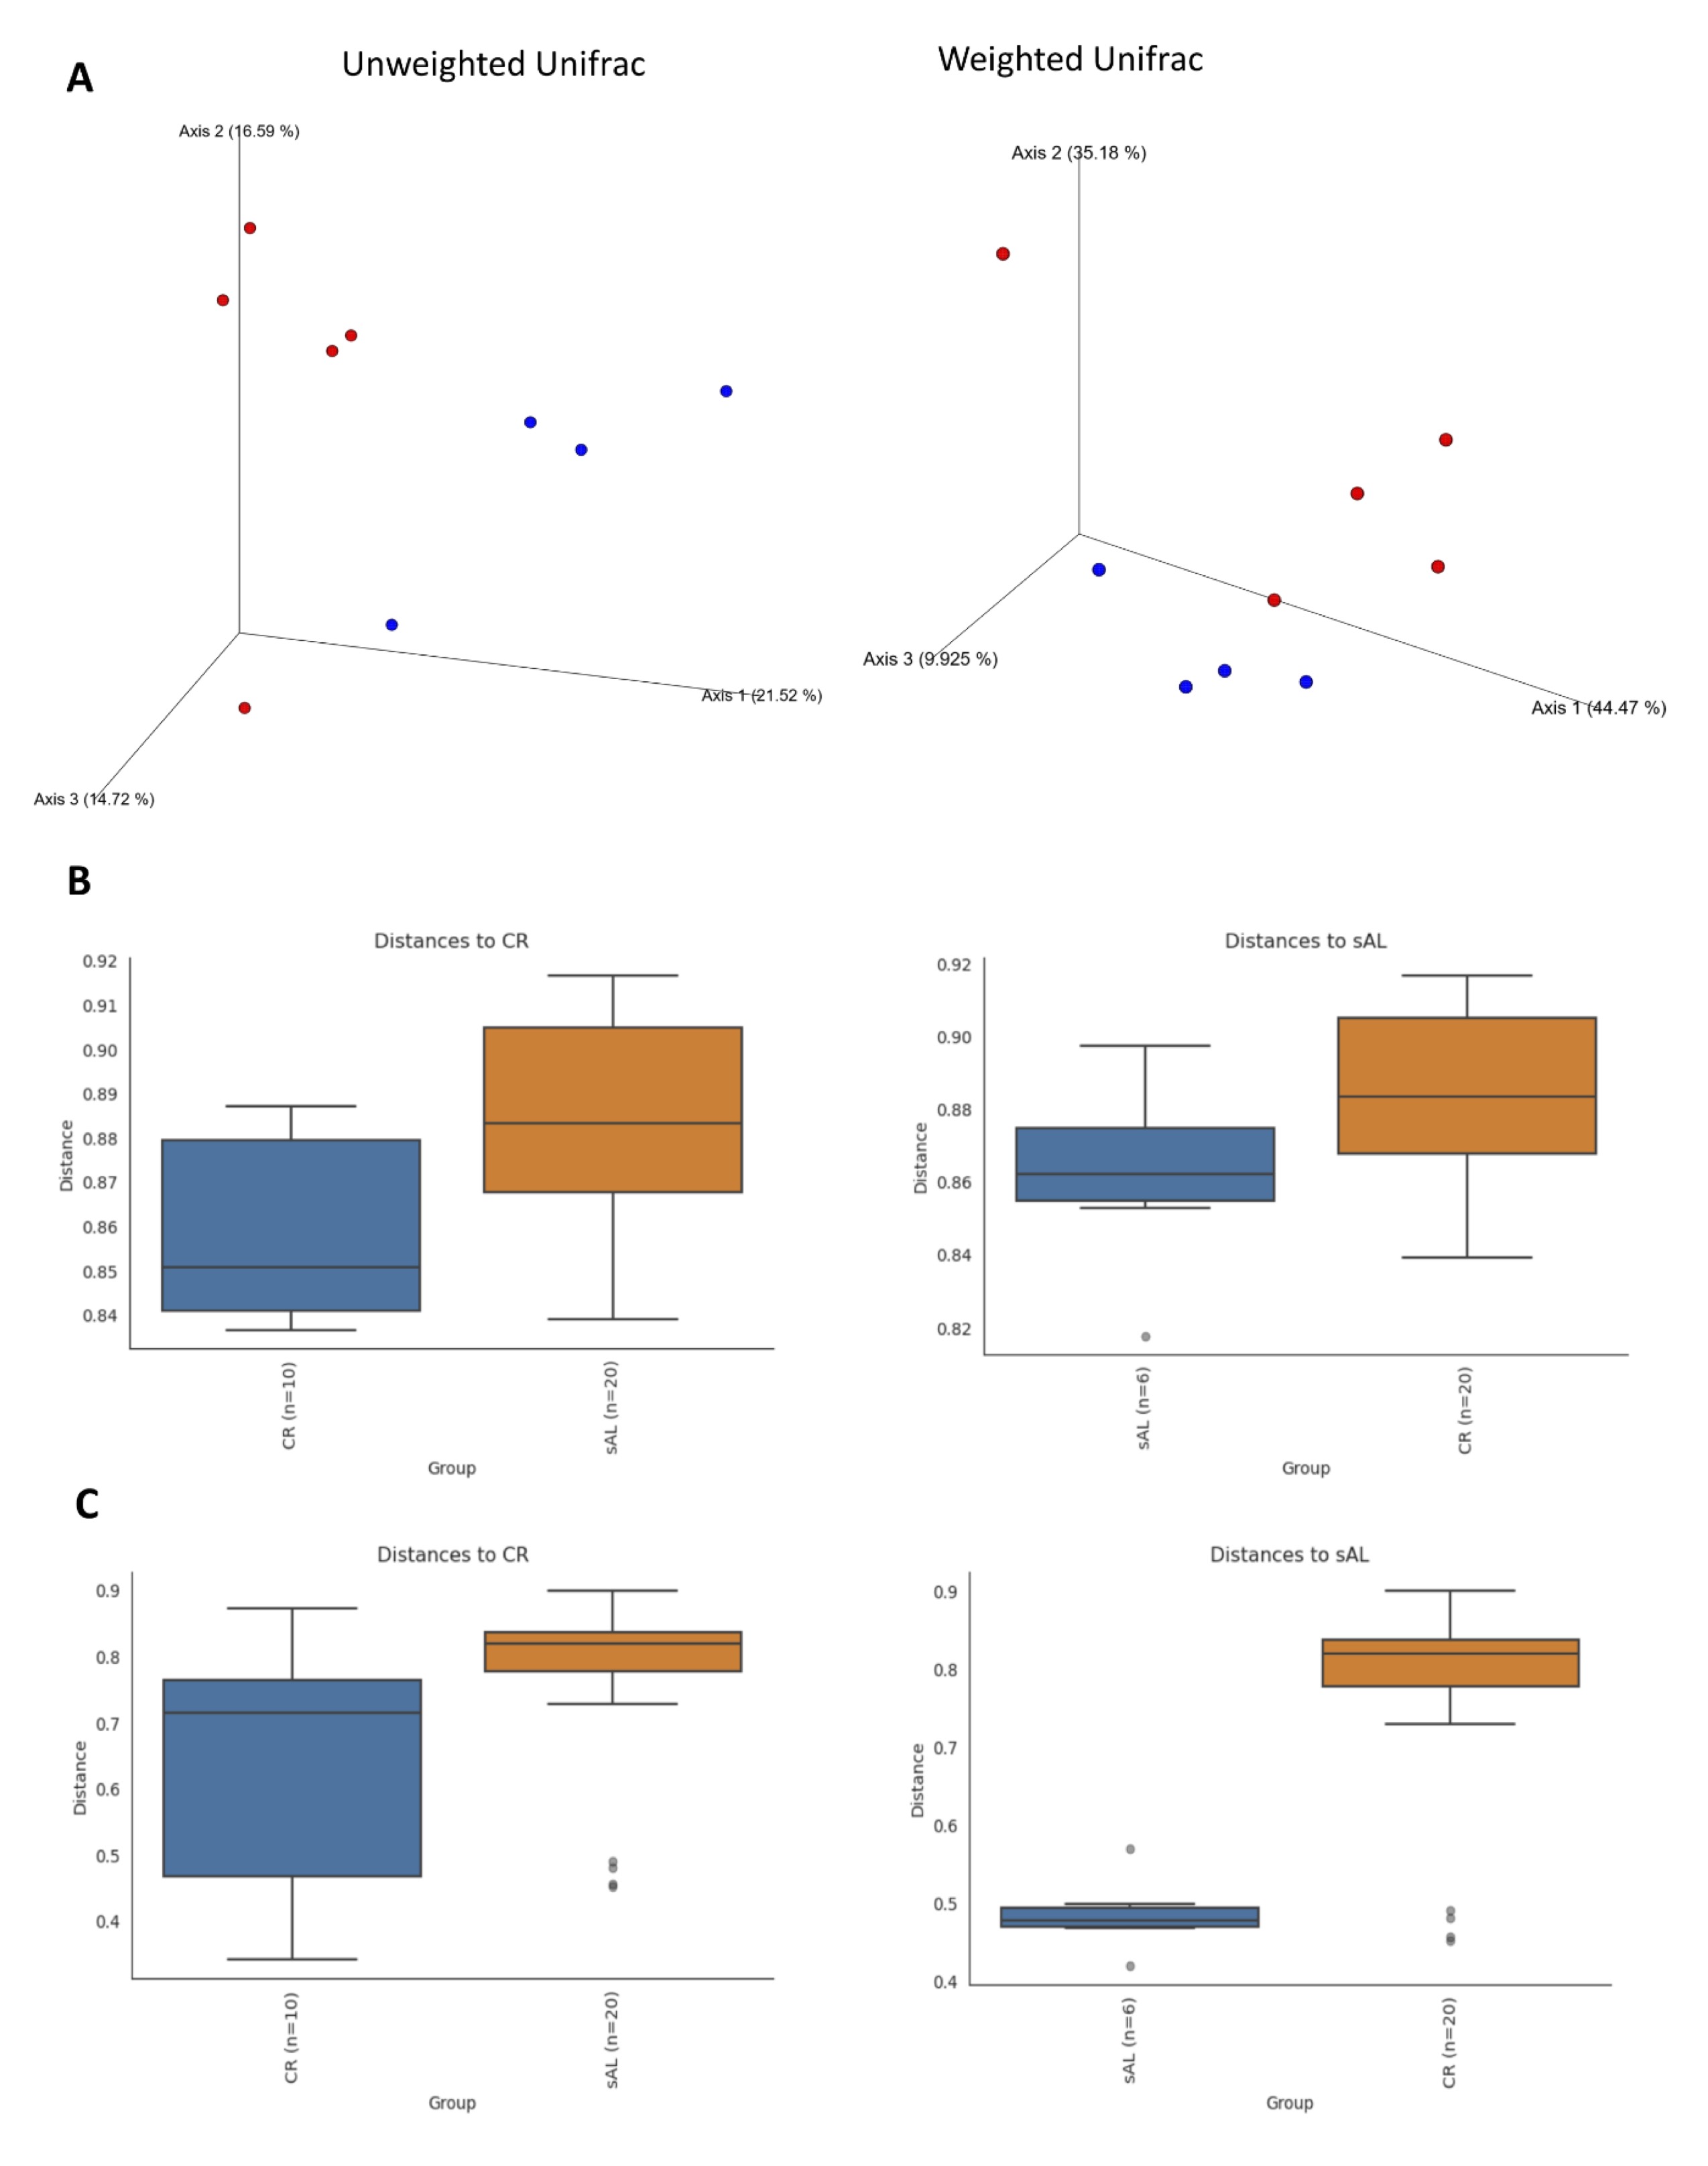
Fig. 5: PCoA plot based on weighted and unweighted Unifrac distances (A) and differentiation analysis based on Jaccard (B) and Bray-Curtis (C) indexes.
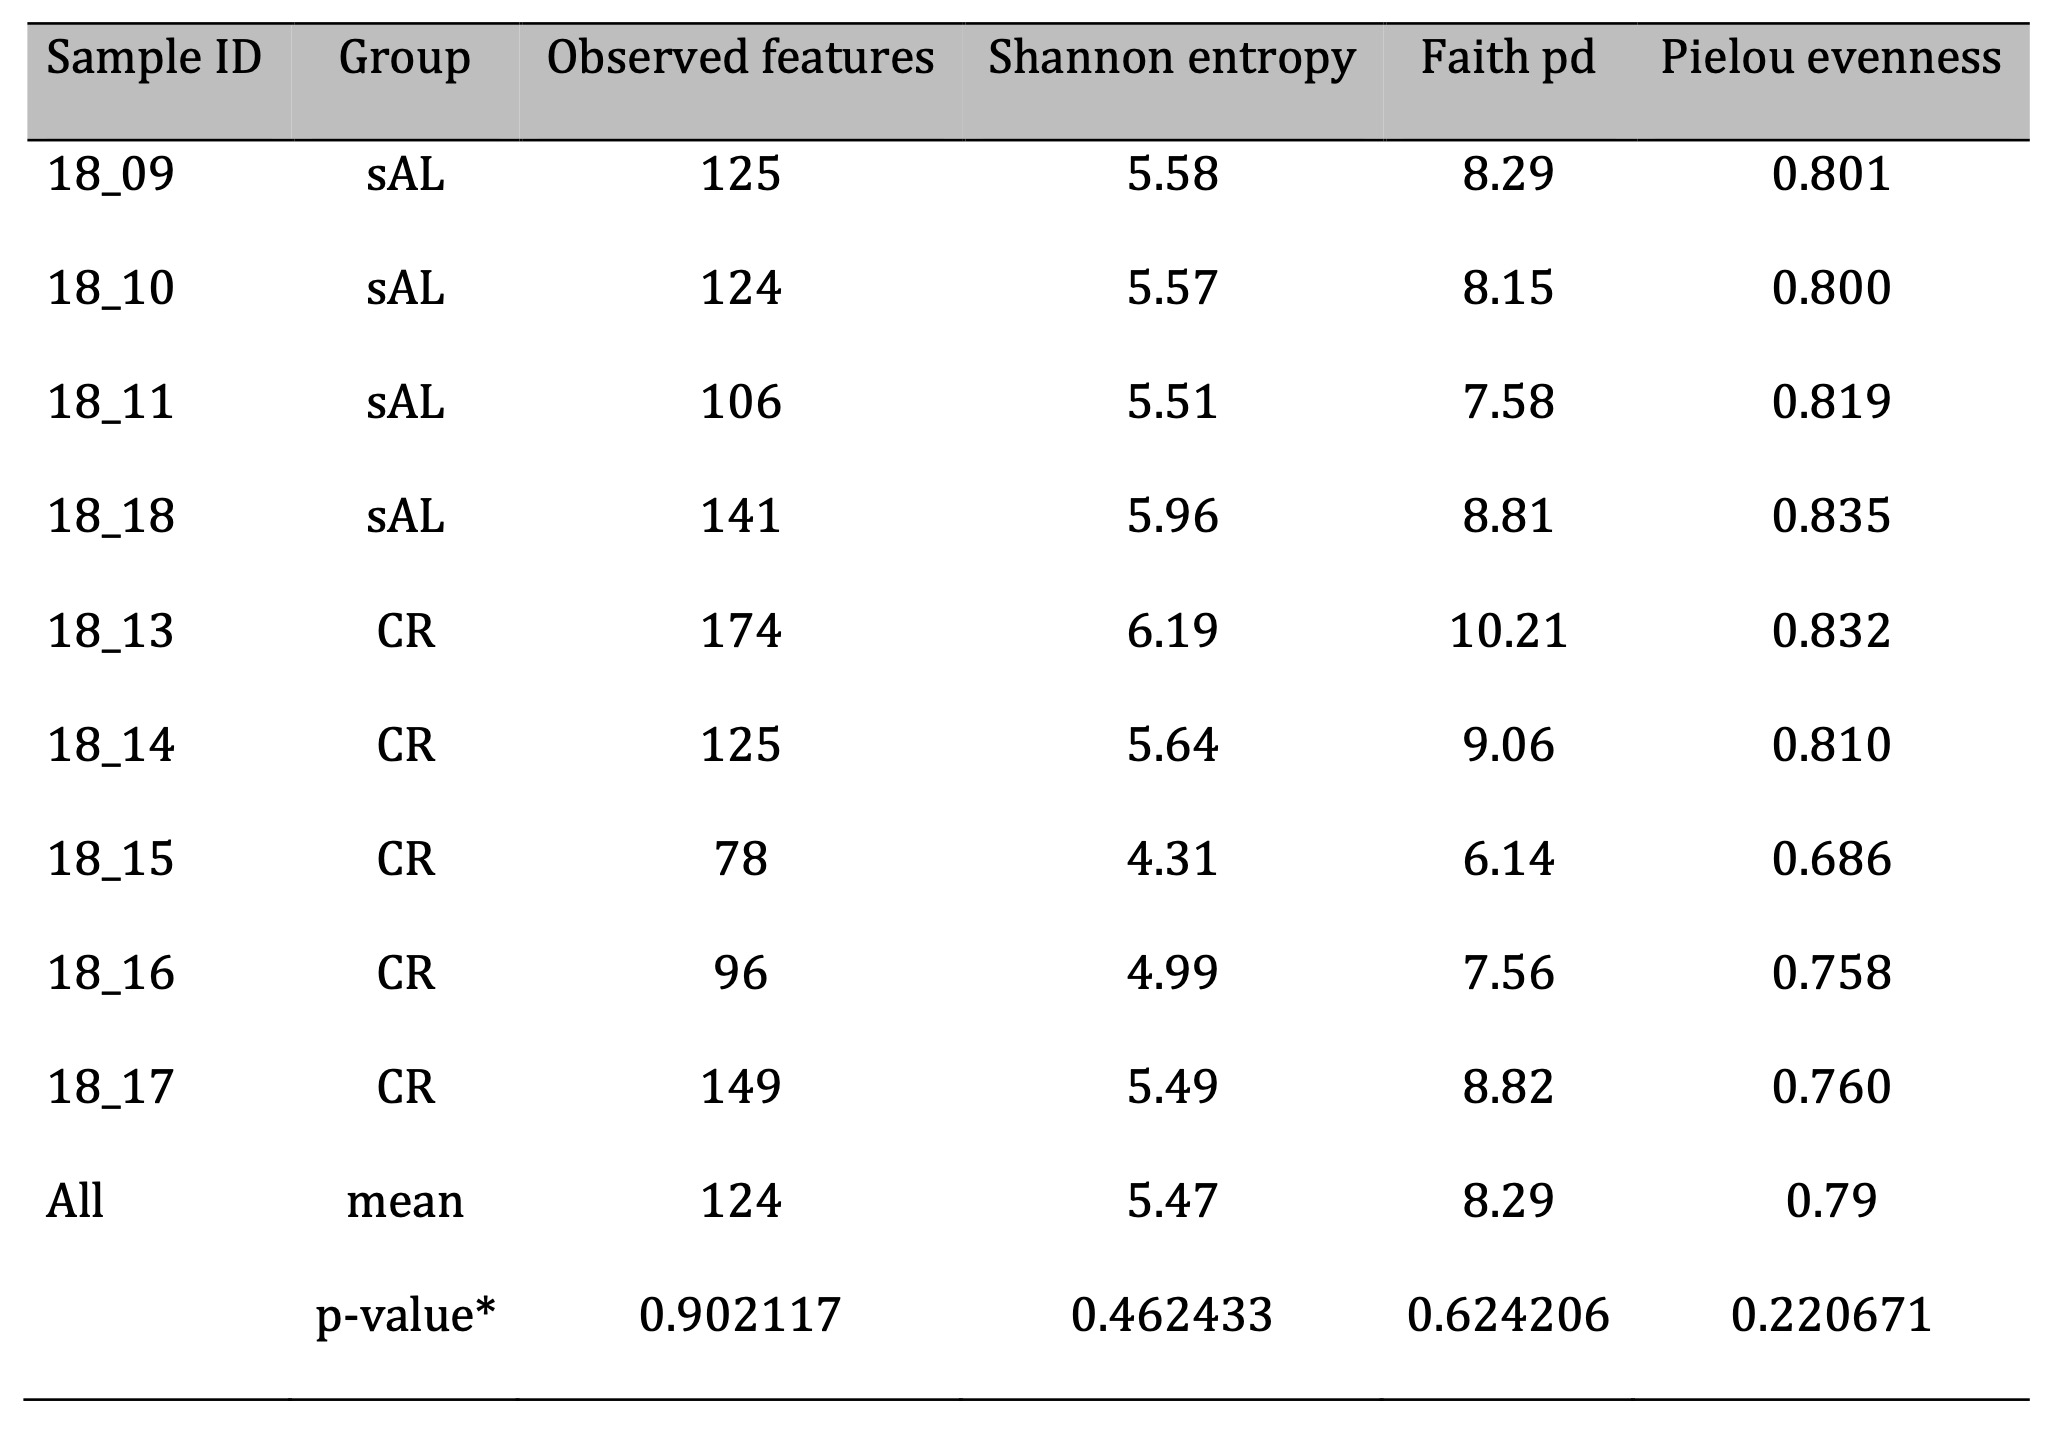
Table 6: Alpha diversity parameters for the analyzed samples. *-p-value of Kruskal-Wallis test for differences among study groups
Microbiome Characterization and Differential Abundance Analysis
The QIIME2 classifier assigned reads to 133 taxa, of which 11 were not classified at the genus level and 39 at the species level. After filtering for abundance (minimum count = 4 and mean abundance among samples = 20%), 82 taxa were retained for further abundance analysis. To simplify the results and ensure high reliability, microbiome data were analyzed at the phylum and genus levels.
At the phylum level, the identified taxa were classified into 51 phyla. The most prevalent were Firmicutes , followed by Bacteroidota and Actinobacteriota . Differential abundance analysis revealed that the abundance of a less common phylum, Verrucomicrobiota , differed significantly among study groups (FDR = 0.044) (Fig. 6; Supplementary File 4).
At the genus level, the most abundant taxa in the sAL group were Streptococcus (37.2%), followed by Lactobacillus (10.3%) and Lachnospiraceae_NK4A136_group (5.9%). In contrast, in the CR group, the most abundant genus was Enterococcus (37%), followed by Streptococcus (9.7%) and Lachnospiraceae_NK4A136_group (8.7%). Notably, no reads associated with Enterococcus were detected in the sAL group.
Differential abundance analysis showed that, at the genus level, the relative abundance of Enterococcus , Clostridium_sensu_stricto_1 , CAG_352 (an uncultured bacterium), and Rikenella (three uncultured bacterial species) varied significantly among study groups (FDR < 0.05). Most of these genera, except CAG_352 , were more prevalent in the CR group (Fig. 7; Supplementary File 4).
In our dataset, the phylum Verrucomicrobiota was represented by the Akkermansia genus, including Akkermansia muciniphila and one unidentified species. The genus Enterococcus included Enterococcus durans and another unclassified species. Clostridium_sensu_stricto_1 comprised a swine fecal species and an additional unidentified microorganism. The raw count table for all microbiota is available in Supplementary File 4.
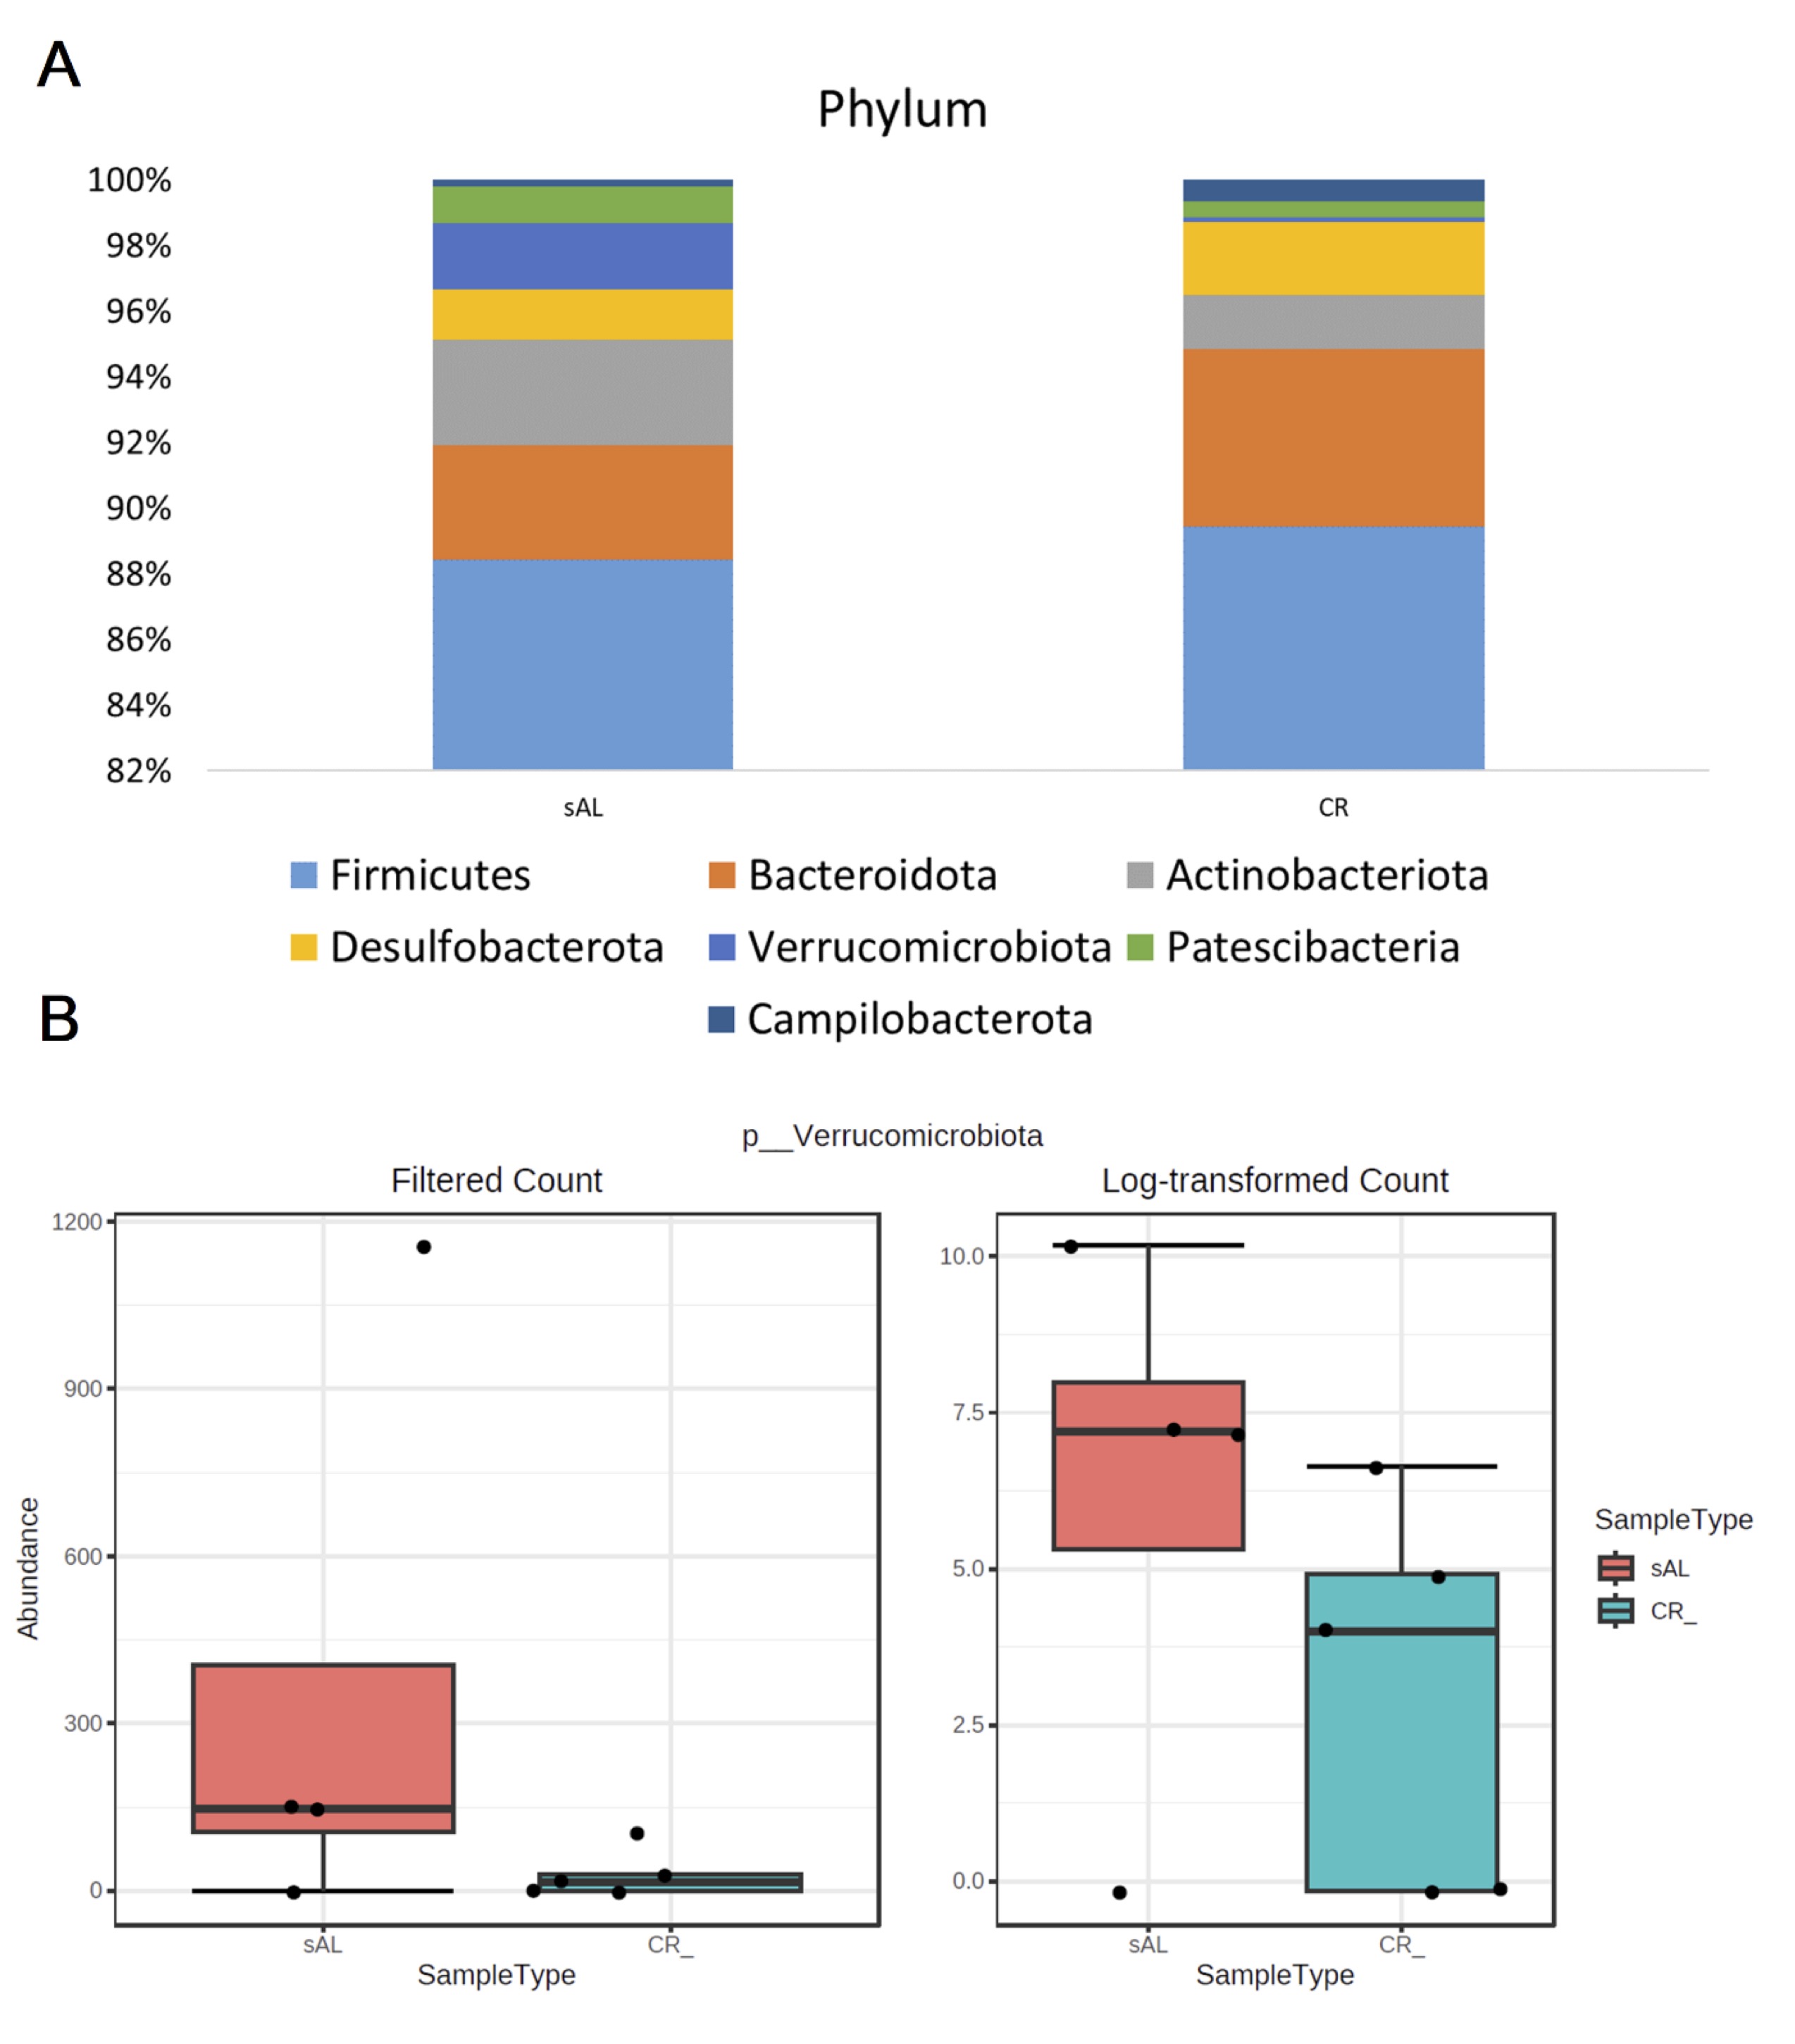
Fig. 6: Phylum level microbiota abundance (A) and box whisker plot for abundance of Verrucomicorbiota phylum which differed significantly among study groups (B).
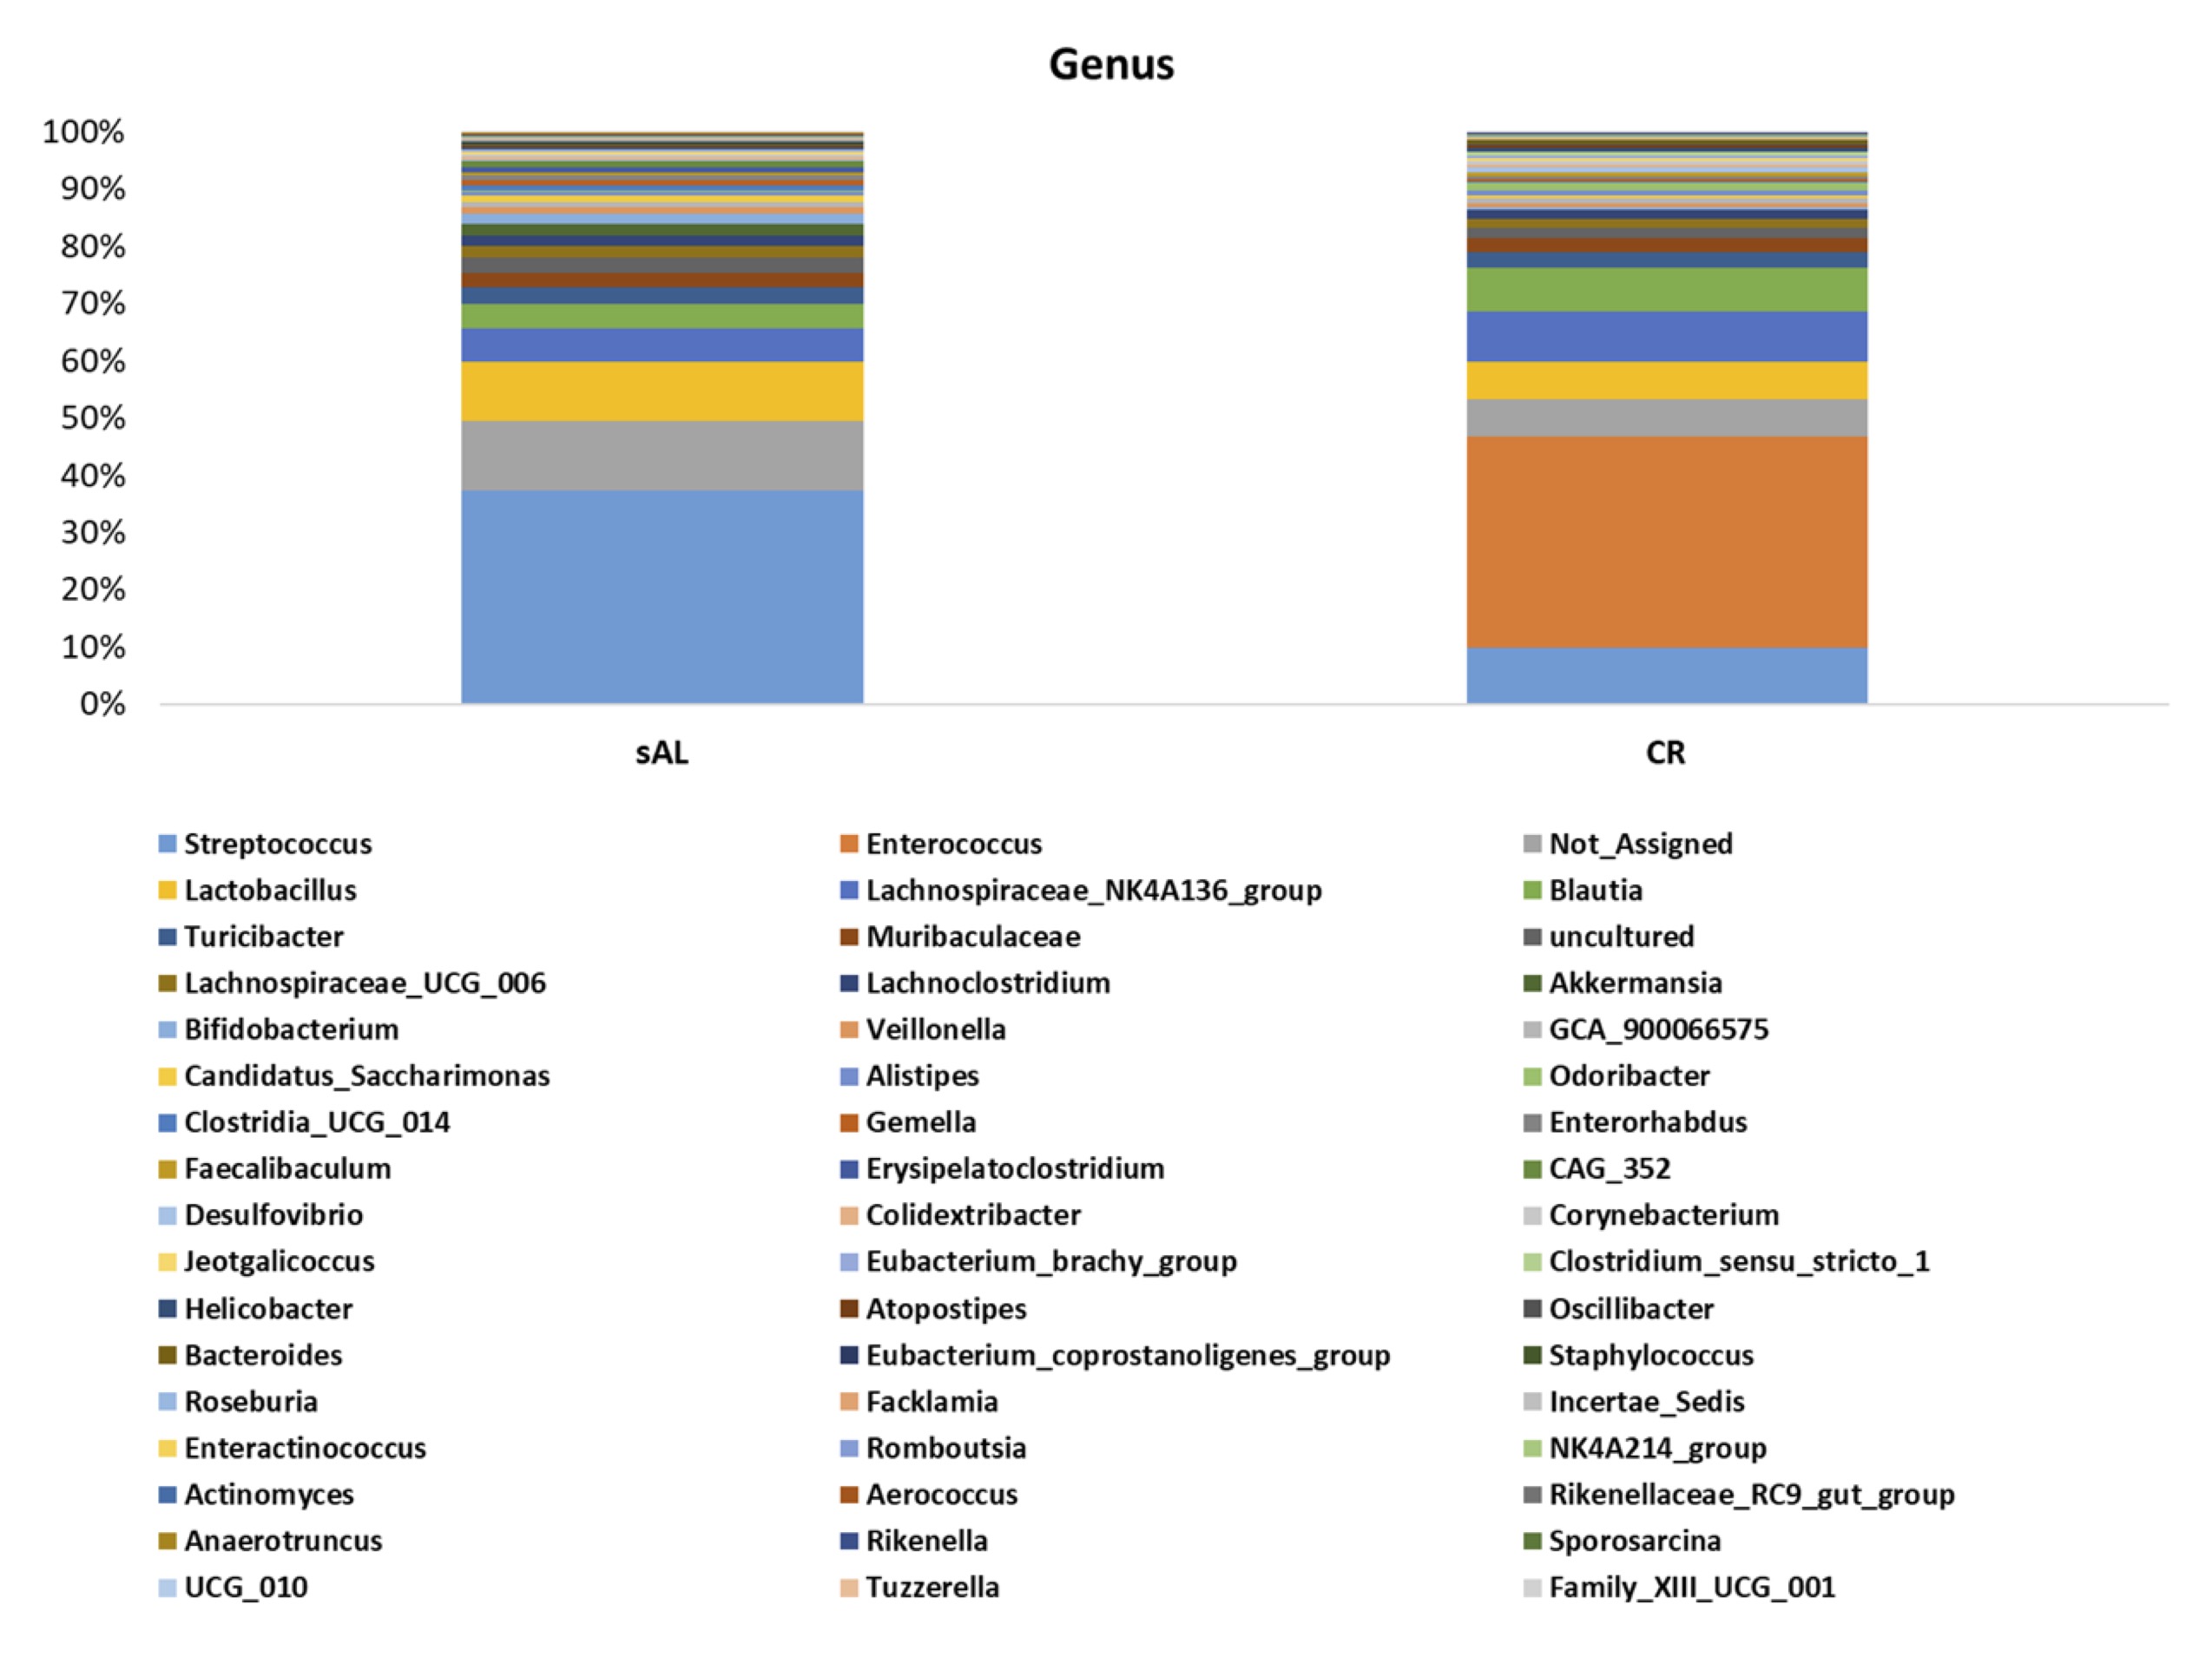
Fig. 7: Genus level microbiota abundance.
Correlation Between Lipid Profile, Blood Glucose Levels, and Microbiome Composition
At the phylum level, four phyla showed significant correlations with the lipid profile in the studied mice. Actinobacteriota exhibited a strong negative correlation (r = -0.915, p < 0.05) with both total cholesterol and LDL levels. In contrast, Verrucomicrobiota abundance correlated positively with HDL levels (r = 0.76, p = 0.017). Additionally, Campilobacterota and Patescibacteria were associated with LDL levels; the former showed a positive correlation (r = 0.687, p = 0.041), while the latter demonstrated a negative correlation (r = -0.674, p = 0.046) (Supplementary File 5). No significant correlations were observed between the identified phyla and blood glucose levels.
At the genus level, 17 genera displayed primarily negative correlations with various cholesterol fractions and triglyceride levels (Supplementary File 5). The strongest and most significant correlations included Family_XIII_UCG_001 (r = -0.815, p = 0.008) with total cholesterol, Erysipelatoclostridium (r = 0.839, p = 0.005) with HDL, Bifidobacterium (r = -0.799, p = 0.01) with LDL, Enterococcus (r = 0.853, p = 0.003) with LDL, and Streptococcus (r = -0.89, p = 0.001) with LDL. Regarding blood glucose levels, strong positive correlations were observed with Streptococcus (r = 0.828, p = 0.006), Bifidobacterium (r = 0.698, p = 0.036), and Roseburia (r = 0.687, p = 0.041).
Discussion
Several studies have shown that calorie restriction initiated either in middle or old age could improve ischemic tolerance and rejuvenate the aging heart [9, 10, 11]. In adult animals, caloric restriction significantly increased lifespan and decreased the rate of occurrence of most age-associated degenerative diseases in rodents. However, the data are not uniform when initiated in young animals [5]. Therefore, the aim of the study was to determine the effect of caloric restriction on atherosclerosis in young and adult ApoE/LDLr-/- mice.
It was shown that CR affects body weight in both young and adult animals by reducing body fat. Weight loss is most severe after the first week of the experiment. Additionally, while adult mice lose more weight than young mice during the first week, they ultimately lose less weight by the end of the experiment. Young animals reduced their body weight by 6.52 g, whereas in adult animals this reduction was smaller (5.97 g). Initial body weight in young mice was 23.27 g, while in adult mice, it was 30.93 g. Similar to Sheng et al. (2017), where body weight was increased in both middle-aged (15 months-AL) and old (22 months-AL) mice compared to young mice, our younger mice were smaller. The highest decrease in body weight was observed after the first week of the experiment (5.9 g in young mice and 7.0 g in adult mice). However, the calculated percentage reduction in body weight was very similar (25% in young and 23% in adult animals). According to Fu and Klaassen [12], body weights of CR mice were lower than AL mice. The final body weights of 15%, 30%, and 40% CR mice were lower than AL mice by 15%, 28%, and 38%, respectively. Beneficial effects of restriction on body weight in adult mice have been confirmed by Donato et al . [13]. Guo et al . [2] showed that a 19-week caloric restriction reduced body weight in ApoE-/- mice. Sheng et al. [5] also reported a decrease in body weight after caloric restriction in young (6-month-old), middle-aged (15-month-old), and older (22-month-old) animals.
Omodei and Fontana [1] confirm that caloric restriction is one of the most effective nutritional interventions protecting against obesity. Reduction in body fat, and thus weight loss due to caloric restriction treatment, contributed to lower leptin synthesis and a simultaneous increase in adiponectin.
The experiment showed that caloric restriction significantly decreased blood glucose levels. Similarly, according to den Hartigh et al . [14], calorie restriction had a beneficial effect on glucose metabolism by improving glucose and insulin tolerance in LDLR-/- mice fed an atherogenic diet.
The present findings indicate that the CR diet had pro-atherosclerotic effects in young animals, characterized by increased total and LDL cholesterol levels as well as an elevated area of atherosclerotic plaque. It was observed that in young animals fed a CR diet, the area of atherosclerosis (en face ) was significantly higher compared to AL mice (by 23%). In contrast, the area of atherosclerosis in the entire aorta of adult CR animals was significantly decreased (by 39%).
Guo et al . [2] stated that a 40% calorie restriction in six-month-old ApoE-/- mice resulted in a statistically significant reduction in the area of atherosclerotic lesions compared to AL animals (29.5 vs. 43.3 × 10³ mm², respectively). In addition, all AL control mice developed both early and advanced atherosclerotic lesions. Such conclusions were drawn by analyzing the fibrous cap, cell-free area in atherosclerotic plaque, and calcification. Advanced atherosclerotic plaque in the aortic root was observed only in half of the animals subjected to caloric restriction. By analyzing the lipid profile, it was shown that caloric restriction reduces triacylglycerol levels but does not affect total cholesterol levels.
Donato et al . [13] used caloric restriction in adult male B6D2F1 mice and demonstrated that CR reduces vessel wall thickness by 30%. Additionally, collagen levels in the thoracic aorta and the amount of MMP-9 decreased in mice from the CR group.
In Sheng’s [5] study, young, middle-aged, or old mice were fed a caloric-restricted diet (40% less than the AL diet) for 3 months to investigate whether caloric restriction provides identical cardiac protection across different ages. Sheng et al . [5] observed that CR significantly reversed aging phenotypes in middle-aged and old mice but had the opposite effect in young mice. According to Sheng et al. [5], CR significantly alleviated mitochondrial damage and decreased lipid accumulation in middle-aged and old mice, while in young mice, the opposite effect was observed.
In our study, Fabp12 , a gene involved in FFA uptake, was found to be downregulated. Atshaves et al. [16] showed that L-FABP null mice exhibited increased fat tissue mass and body weight depending on age and sex. According to Atshaves et al . [16], L-FABP enhances the uptake and transport of long-chain fatty acids in the liver, increases oxidation and esterification, and regulates LCFA and glucose metabolism through nuclear receptors.
Wang et al . [17] indicated that triglyceride and total cholesterol levels in the liver, as well as triglyceride levels in gonadal adipose tissue, significantly increased in LDL -/- mice fed an atherogenic diet. The gene expression of CYP7α was decreased in GAT , while ACSL5, CD36, ABCA1, and SR-B1 were upregulated. Compared to the control diet, the atherogenic diet tended to decrease Fabp5 expression in both the liver and gonadal adipose tissue.
Contrarily, Furuhashi [18] demonstrated that the absence of Fabp4 inhibits atherosclerosis in ApoE -/- mice. In macrophages, Fabp4 increased cholesterol ester formation and foam cell development while inducing inflammatory responses. Moreover, the absence of FABP4 in macrophages reduced redox signaling and activation of inflammasome complexes.
In our study, upregulation of the flavin-containing monooxygenase 3 (Fmo3) gene was observed in young animals. Flavin-containing monooxygenases catalyze the oxidation of a wide range of xenobiotics [19], making these substrates more polar, less pharmacologically active, and more easily excreted [20]. Human FMO3 contributes to the metabolic clearance of drugs (cimetidine, nicotine, tamoxifen) and diet-derived substrates such as trimethylamine [20]. According to Fu and Klaassen [12], 40% CR increased Fmo3 mRNA levels. In general, CR alters Fmo mRNA levels in the liver, increasing Fmo1, Fmo2, Fmo3, and Fmo4 while decreasing Fmo5 and Fmo9 . Our study, along with findings from other authors, suggests that CR markedly upregulates Fmo3 , indicating a significant increase in oxidative metabolism and clearance of its substrates.
Additionally, it was observed that P450 enzymes are upregulated by CR. Phase I enzymes mediate oxidation, reduction, and hydrolysis of xenobiotics. Cytochrome P450s (P450s) , particularly those in the Cyp1, Cyp2, and Cyp3 families, are primarily involved in xenobiotic metabolism, whereas the Cyp4 family processes fatty acids and eicosanoids [21]. According to Fu et al . [12], Cyp4a14 mRNA levels increased by 534% following 30% CR and by 12.1-fold after 40% CR. Overall, CR modifies the mRNA expression of P450 -related enzymes in the liver, significantly increasing Cyp4a14, Cyp1a1, Nqo1, and Por [12].
Caloric restriction influenced atherosclerosis in mice, demonstrating distinct metabolic activity in young and adult individuals. An opposite effect of CR on atherosclerotic development was observed in ApoE/LDLR -/- mice, with adult animals experiencing a reduction in atherosclerotic plaque area, while young ones exhibited intensified atherosclerotic lesions. The biochemical, histological, and microarray analyses suggest that the mechanisms underlying the CR-induced progression of atherosclerosis in young animals may stem from a deteriorated lipid profile, dysregulated inflammation, or altered fatty acid metabolism. Additionally, the results indicate that caloric restriction may lead to adverse changes in intestinal microbiota, which plays a crucial role in the etiology of atherosclerosis.
At the phylum level, the seven dominant intestinal microbiota included Firmicutes, Bacteroidota, Actinobacteriota, Desulfobacterota, Verrucomicrobia, Patescibacteria, and Campilobacterota . Notably, CR significantly decreased Verrucomicrobia . At the genus level, compared to the control group, CR led to an increased relative abundance of Enterococcus, Clostridium_sensu_stricto_1, and Rikenella , while CAG_352 abundance was significantly lower (P < 0.05) in young mice fed the CR diet.
According to Gupta et al . [22], certain bacterial species, including Clostridium spp., Anaerococcus hydrogenalis, Escherichia fergusonii, Proteus penneri, Providencia rettgeri, and Edwardsiella tarda , have been isolated and shown to produce TMA in vitro . Rath et al . [23] demonstrated that potential TMA -producing bacteria primarily belong to Clostridiales and Enterobacteriaceae . Furthermore, Clostridium_sensu_stricto_1 has been identified as a key participant in TMA formation [23]. Wang et al . [24] reported that Clostridiaceae proportions were highly positively correlated with plasma TMA and TMAO levels, as well as with atherosclerotic lesion area in mice. Similarly, Shi et al . [25] showed that IL‐1β and TNF‐α mRNA expression were positively associated with Clostridium_sensu_stricto_1 abundance in the colon of sheep, potentially contributing to epithelial inflammation. Clostridium spp. has been suggested as a “conditioned pathogen,” with an enrichment of Clostridium_sensu_stricto_1 potentially exacerbating symptoms in mouse models of rheumatoid arthritis. This enrichment may also explain the negative effects of CR on atherosclerosis and dyslipidemia [25].
Our findings also indicate that CR treatment tended to reduce the abundance of Akkermansia (0.00149 vs. 0.01996; p = 0.07) in the gut. This genus belongs to the Verrucomicrobia phylum and is an intestinal mucin-degrading bacteria, forming an essential component of gut microbiota [25]. Recent studies have highlighted the anti-atherosclerotic effects of Akkermansia , attributing its protective role to anti-inflammatory activity and gut barrier regulation. Akkermansia adheres to enterocytes lining the intestinal tract, enhancing epithelial integrity and preventing intestinal leakage. It also activates intestinal immunity, with studies demonstrating that Akkermansia preserves the gut barrier by upregulating tight junction proteins that protect against atherosclerosis in ApoE -/- mice [25].
We observed that, compared to the control group, caloric restriction (CR) resulted in a higher relative abundance of Rikenella , an important genus involved in lipid metabolism [26, 27]. Rikenella may contribute to lipid and glucose metabolism disorders, potentially imposing a physiological burden on the heart and blood vessels [28].
Changes in gut microbiota composition could be a part of age-related physiological processes [34]. Zhu et al . [34] demonstrated that young and middle-aged rats responded differently to the intake of chicken protein. In middle-aged rats, a reduction in the Firmicutes phylum and an increase in Bacteroidota were observed, while young rats exhibited the opposite trend. These differences may stem from variations in protein digestion and absorption capacities between young and middle-aged rats, leading to different amounts of undigested proteins reaching the large intestine and subsequently altering gut microbiota composition.
Furthermore, the CR regimen modulated biochemical parameters in middle-aged but not in old mice. Vatashchuk et al . [35] investigated the effects of aging and CR on glycolytic enzyme activity and oxidative stress parameters in the liver, cerebral cortex, and kidney of middle-aged (9 months) and old (18 months) C57BL6/N mice. In old mice fed an ad libitum (AL) diet, the liver and kidneys showed higher glucose-6-phosphate dehydrogenase activity, a key enzyme in the pentose phosphate pathway producing NADPH, compared to middle-aged mice. CR reduced oxidative stress intensity in the liver and kidney of middle-aged mice. In the liver, CR decreased glycolytic enzyme activity, while in the kidney, the opposite effect was observed [35].
Yu et al . [36] highlighted that the intestine is not only responsible for lipid digestion and absorption but also serves as a habitat for gut microbiota, which plays a crucial role in modulating dietary lipid composition, digestion, and absorption. These microbial interactions can impact intestinal lipoprotein formation, as seen in germ-free (GF) and antibiotic-treated mice, where abnormal lipoprotein levels were observed [36]. In vitro studies have shown that Bifidobacterium, Lactobacillus, and Propionibacterium strains can biotransform the omega-3 fatty acid alpha-linolenic acid into conjugated linolenic acid isomers. Additionally, Bifidobacterium species possess enzymes that convert linoleic acid into conjugated linoleic acid, subsequently producing molecules that activate GPR40 and GPR120, leading to anti-inflammatory signaling [37].
Thus, the CR treatment mouse model of atherosclerosis influenced both dyslipidemia and atherosclerosis while altering intestinal microbiota composition, suggesting a potential relationship between these factors. The interactions between CR, genetics, lifestyle, and aging require further exploration to fully understand their impact on health.
Although studies have investigated the effects of CR on gut microbiota, more research is needed to elucidate the relationship between microbiota composition and disease development.
Acknowledgements
The experiments were approved by the I Local Animal Ethics Commission in Kraków (no 28/2016). We thank Professor S. Chłopicki for methodological support. Final editing of the manuscript was done by grammaryl.com.
Author Contributions
RBK designed the study. RBK, MFZ, and AM performed experiments. RBK, MHM, SL, AŻ, and IJ contributed to analysis. AŻ, and IJ analyzed microbiota. RBK, AŻ performed statistical analyses. Data analysis and interpretation was performed by RBK and IW. All authors have read and approved the final manuscript.
Funding Sources
This work was supported by the European Union from the resources of the European Regional Development Fund under the Innovative Economy Programme (grant coordinated by JCET-UJ, No. POIG.01.01.02-00-069/09).
Statement of Ethics
The experiments were approved by the I Local Animal Ethics Commission in Krakow (Medyczna 9, 30-688 Kraków, Poland) no 28/2016. Animal experiments conform to internationally accepted standards and have been approved by the appropriate institutional review body.
Disclosure Statement
The authors have no conflicts of interest to declare. No AI tools have been used to create this work.
References
| 1 | Omodei D, Fontana L: Calorie restriction and prevention of age-associated chronic disease. FEBS Lett. 2011;6, 585, 11:1537-1542.
https://doi.org/10.1016/j.febslet.2011.03.015 |
| 2 | Guo Z. et al.: Dietary restriction reduces atherosclerosis and oxidative stress in the aorta of apolipoprotein E- deficient mice. Mech. Ageing Dev. 2002;123:1121-1131.
https://doi.org/10.1016/S0047-6374(02)00008-8 |
| 3 | Lefevre M. et al.: Caloric restriction alone and with exercise improves CVD risk in healthy non-obese individuals. Atherosclerosis. 2009;203(1):206-213.
https://doi.org/10.1016/j.atherosclerosis.2008.05.036 |
| 4 | Fontana L, Meyer TE, Klein S, Holloszy JO: Long-term calorie restriction is highly effective in reducing the risk for atherosclerosis in humans. Proc Natl Acad Sci U S A. 2004;101:6659-6663.
https://doi.org/10.1073/pnas.0308291101 |
| 5 | Sheng Y, et al.: Opposing effects on cardiac function by calorie restriction in different-aged mice. Aging Cell. 2017;16(5):1155-1167.
https://doi.org/10.1111/acel.12652 |
| 6 | Harrison DE, Archer JR: Genetic differences in effects of food restriction on aging in mice. J Nutr. 1987;117(2):376-382.
https://doi.org/10.1093/jn/117.2.376 |
| 7 | Kostogrys RB, Franczyk-Zarow M, Manterys A, Wybranska I: Effect of caloric restriction on liver function in young and old ApoE/LDLr-/- mice. Rocz Panstw Zakl Hig. 2018;69(1);37-43.
|
| 8 | Reeves PG, Nielsen FH, Fahey GC, Jr: AIN-93 purified diets for laboratory rodents: final report of the American Institute of Nutrition ad hoc writing committee on the reformulation of the AIN-76A rodent diet. J Nutr. 1993;123(11):1939-1951.
https://doi.org/10.1093/jn/123.11.1939 |
| 9 | Peart JN, See Hoe L, Pepe S, Johnson P, Headrick JP: Opposing effects of age and calorie restriction on molecular determinants of myocardial ischemic tolerance. Rejuvenation Res. 2012;15(1):59-70.
https://doi.org/10.1089/rej.2011.1226 |
| 10 | Yan L, et al.: Calorie restriction can reverse, as well as prevent, aging cardiomyopathy. Age (Dordr). 2013;35, 6:2177-2182.
https://doi.org/10.1007/s11357-012-9508-5 |
| 11 | Dai DF. et al.: Altered proteome turnover and remodeling by short-term caloric restriction or rapamycin rejuvenate the aging heart. Aging Cell. 2014;13(3);529-539.
https://doi.org/10.1111/acel.12203 |
| 12 | Fu ZD, Klaassen CD: Short-term Calorie Restriction Feminizes the mRNA Profiles of Drug Metabolizing Enzymes and Transporters in Livers of Mice Toxicol. Appl. Pharmacol. 2014;1, 274:137-146.
https://doi.org/10.1016/j.taap.2013.11.003 |
| 13 | Donato AJ: Life-long caloric restriction reduces oxidative stress and preserves nitric oxide bioavailability and function in arteries of old mice. Aging Cell. 2013;12, 5:772-783.
https://doi.org/10.1111/acel.12103 |
| 14 | den Hartigh LJ, et al.: Obese Mice Losing Weight Due to trans-10, cis-12 Conjugated Linoleic Acid Supplementation or Food Restriction Harbor Distinct Gut Microbiota. J Nutr. 2018;148, 4:562-572.
https://doi.org/10.1093/jn/nxy011 |
| 15 | Fasano C, Disciglio V, Bertora S, Signorile ML, Simone C: FOXO3a from the Nucleus to the Mitochondria: A Round Trip in Cellular Stress Response Cells 2019;19, 8(9):1110.
https://doi.org/10.3390/cells8091110 |
| 16 | Atshaves BP, Martin GG, Hostetler HA, McIntosh AL, Kier AB, Schroeder F: Liver fatty acid-binding protein and obesity. J Nutr Biochem. 2010;21, 11:1015-1032.
https://doi.org/10.1016/j.jnutbio.2010.01.005 |
| 17 | Wang S. et al.: Aortic cholesterol accumulation correlates with systemic inflammation but not hepatic and gonadal adipose tissue inflammation in low-density lipoprotein receptor null mice. Nutr Res. 2013;33(12):1072-1082.
https://doi.org/10.1016/j.nutres.2013.09.002 |
| 18 | Furuhashi M: Fatty Acid-Binding Protein 4 in Cardiovascular and Metabolic Diseases. J Atheroscler Thromb. 2019;1, 26(3):216-232.
https://doi.org/10.5551/jat.48710 |
| 19 | Hines RN, Cashman JR, Philpot RM, Williams DE, Ziegler DM: The mammalian flavin-containing monooxygenases: molecular characterization and regulation of expression. Toxicol Appl Pharmacol. 1994;125(1):1-6.
https://doi.org/10.1006/taap.1994.1042 |
| 20 | Cashman JR: Human flavin-containing monooxygenase: substrate specificity and role in drug metabolism. Curr Drug Metab. 2000;1, 2:181-191.
https://doi.org/10.2174/1389200003339135 |
| 21 | Renaud HJ, Cui JY, Khan M, Klaassen CD: Tissue distribution and gender-divergent expression of 78 cytochrome P450 mRNAs in mice. Toxicol Sci. 2011;124(2):261-277.
https://doi.org/10.1093/toxsci/kfr240 |
| 22 | Gupta H, Min B-H, Ganesan R, Gebru YA, Sharma SP, Park E, Won S-M, Jeong J-J, Lee S-B, Cha M-G, Kwon G-H, Jeong M-K, Hyun J-Y, Eom J-A, Park H-J, Yoon S-J, Choi M-R, Kim D-J, Suk K-T: Gut Microbiome in Non-Alcoholic Fatty Liver Disease: From Mechanisms to Therapeutic Role. Biomedicines 2022;10(3):550.
https://doi.org/10.3390/biomedicines10030550 |
| 23 | Rath S, Rud T, Karch A, Pieper DH, Vital M: Pathogenic functions of host microbiota. Microbiome 2018;6:174.
https://doi.org/10.1186/s40168-018-0542-0 |
| 24 | Wang Z, Roberts AB, Buffa JA, Levison BS, Zhu W, Org E, Gu X, Huang Y, Zamanian-Daryoush M, Culley MK, DiDonato AJ, Fu X, Hazen JE, Krajcik D, DiDonato JA, Lusis AJ, Hazen SL: Non-lethal Inhibition of Gut Microbial Trimethylamine Production for the Treatment of Atherosclerosis. Cell. 2015;17, 163(7):1585-95.
https://doi.org/10.1016/j.cell.2015.11.055 |
| 25 | Shi N, Zhang S, Silverman G, Li M, Cai J, Niu H: Protective effect of hydroxychloroquine on rheumatoid arthritis-associated atherosclerosis. Animal Model Exp Med. 2019;19, 2(2):98-106.
https://doi.org/10.1002/ame2.12065 |
| 26 | Hu C, Wang P, Yang Y, Li J, Jiao X, Yu H, Wei Y, Li J, Qin Y: Chronic intermittent hypoxia participates in the pathogenesis of atherosclerosis and perturbs the formation of intestinal microbiota. Frontiers in Cellular and Infection Microbiology 2021;11:56020.
https://doi.org/10.3389/fcimb.2021.560201 |
| 27 | Zhou L, Xiao X, Zhang Q, Zheng J, Li M, Yu M, Wang X, Deng M, Zhai X, Li R: Improved glucose and lipid metabolism in the early life of female offspring by maternal dietary genistein is associated with alterations in the gut microbiota. Frontiers in Endocrinology 2018;9, 516(2018).
https://doi.org/10.3389/fendo.2018.00516 |
| 28 | Bao N, Liu X, Zhong X, Jia S, Hua N, Zhang L, Mo G: Dapagliflozin-affected endothelial dysfunction and altered gut microbiota in mice with heart failure. PeerJ 2023;11, e15589.
https://doi.org/10.7717/peerj.15589 |
| 29 | Benjamini Y, Hochberg Y: Controlling the false discovery rate: a practical and powerful approach to multiple hypothesis testing. J R Stat Soc B 1995;57:289-300.
https://doi.org/10.1111/j.2517-6161.1995.tb02031.x |
| 30 | Bolyen E, Rideout JR, Dillon MR, et al.: Reproducible, interactive, scalable and extensible microbiome data science using QIIME 2 Nat Biotechnol 2019;37:852-857.
|
| 31 | Callahan BJ, McMurdie PJ, Rosen MJ, et al.: DADA2: High-resolution sample inference from Illumina amplicon data. Nat Methods 2016;13:581-583.
https://doi.org/10.1038/nmeth.3869 |
| 32 | Dhariwal A, Chong J, Habib S, et al.: MicrobiomeAnalyst: a web-based tool for comprehensive statistical, visual and meta-analysis of microbiome data. Nucleic Acids Res 2017;45:W180-W188.
https://doi.org/10.1093/nar/gkx295 |
| 33 | Robinson MD, McCarthy DJ, Smyth GK: edgeR:a Bioconductor package for differential expression analysis of digital gene expression data. Bioinformatics 2010;26:139-140.
https://doi.org/10.1093/bioinformatics/btp616 |
| 34 | Zhu Y, Li H, Xu X, Li Ch, Zhou G: The gut microbiota in young and middle-aged rats showed different responses to chicken protein in their diet BMC Microbiol. 2016;25;16:281 doi: 10.1186/s12866-016-0895-0
https://doi.org/10.1186/s12866-016-0895-0 |
| 35 | Vatashchuk MV, Hurza VV, Stefanyshyn N, Bayliak MM, Gospodaryov DV, Garaschuk O, Lushchak VI: Impact of caloric restriction on oxidative stress and key glycolytic enzymes in the cerebral cortex, liver and kidney of old and middle-aged mice Neuropharmacology 2024;247, 109859
https://doi.org/10.1016/j.neuropharm.2024.109859 |
| 36 | Yu Y, Raka F, Adeli K: The Role of the Gut Microbiota in Lipid and Lipoprotein Metabolism. J Clin Med. 2019;17;8(12):2227 doi: 10.3390/jcm8122227
https://doi.org/10.3390/jcm8122227 |
| 37 | Brown EM, Clardy J, Xavier RJ: Gut microbiome lipid metabolism and its impact on host physiology Cell Host & Microbe 2023;31, 2:173-186
https://doi.org/10.1016/j.chom.2023.01.009 |