Methylglyoxal Reshapes Hepatic and Adipose Tissue Metabolism and Increases Viability of Lymphocytes
bDepartment of Biotechnology, Genetics, and Cellular Biology, State University of Maringá, PR, Brazil,
cDepartment of Anesthesiology and Perioperative Medicine, Mayo Clinic, Jacksonville, FL, USA
Keywords
Abstract
Background/Aims:
Methylglyoxal (MG) is associated with the development of metabolic disorders that modify the hepatic energetic metabolism in different ways. However, not much is known about the effects of MG on energy metabolism in healthy liver cells. Therefore, this study investigated the effects of daily MG administration to Wistar rats on hepatic and fat tissue energetic metabolism.Methods:
Rats received MG intraperitoneally at doses of 100 or 200 mg/kg for seven consecutive days in acute approach or at a dose of 25 mg/kg for one month in the chronic approach. Metabolic pathways were measured in isolated perfused livers (glycogen catabolism, gluconeogenesis and ketogenesis) as well in adipose tissue. Activities and mRNA expressions of gluconeogenic enzymes were assessed in the liver and the viability of human lymphocytes were evaluated in vitro.Results:
MG displayed systemic inflammation and the metabolic changes were similar to those of widespread catabolic diseases. MG and advanced glycation end-products stimulated lymphocyte proliferation, and MG increased the hepatic interleukin-6 expression. Rats that received MG developed insulin resistance. Gluconeogenesis was diminished and glycolysis was stimulated in livers of rats that received MG. Two factors contribute to this outcome: a deficiency in mitochondrial energy supply and a much more significant downregulation of gluconeogenic enzymes. The adipose tissue metabolism was modified in a way that the AMPK-induced lipolysis was increased in the retroperitoneal fat, but not in the mesenteric fat. Ketogenesis was increased and triglycerides content was decreased in the liver.Conclusion:
To what degree the modifications in hepatic metabolism found in MG-exposed rats can be translated to patients with a high-grade inflammation and cirrhosis is uncertain. However, it is unlikely that the strong catabolic state induced by MG would not contribute in some way to the hepatic dysfunction in advanced liver diseases.Introduction
Methylglyoxal (MG) is a glycotoxin derived mainly from the trioses-phosphate (glycolytic intermediates). Increased intracellular levels of glucose or fructose drive the non-enzymatic production of MG and other α-oxaldehydes via formation of Amadori products [1]. MG may also derive from lipids and proteins [2] and, once formed, promptly reacts with macromolecules, particularly proteins, to form advanced glycation end products (AGE) [1]. The main route of AGE generation is the reaction of MG with primary amines (N-terminal groups or side chain of lysine) or the guanidine group of arginine [3]. MG and AGE are known to deteriorate a variety of cell functions and are involved in the onset and progression of many metabolic disorders, such as obesity and diabetes [4]. In contrast, the glyoxalase system is the main route of MG detoxification, in which two enzymes, glyoxalases I and II, act in sequence to convert MG into lactate in a process dependent on reduced glutathione (GSH) [5].
The mechanisms by which MG and AGE cause deleterious effects involves structural modifications of intra- and extracellular proteins [4, 6]. Both MG and AGE modify collagen and other extracellular matrix proteins. Inside the cell, MG causes oxidative stress and modifies proteins involved in gene transcription. Extracellular AGE bind to AGE receptors (RAGE) and activate intracellular signaling pathways that lead to inflammation and oxidative stress. In turn, the RAGE expression is known to be upregulated by inflammatory cytokines and reactive oxygen species (ROS) through the activation of nuclear factor-kappa B (NF-κB) [7]. MG and AGE also downregulate the expression of glyoxalases in such metabolic disorders, a condition that leads to an even higher accumulation of these compounds [4].
Endogenous production is not the only source of MG and AGE because they are also formed in foods by Maillard reactions. Once absorbed from the digestive tract [8] they reach the liver, which is also the main site for their clearance [9]. Endogenous extrahepatic MG and AGE also reach the liver, contributing to an overloading that, under certain circumstances, substantially increases the chances of damage. Overloading of the liver also occurs in systemic diseases and is directly associated to the severity of the hepatic diseases [10, 11]. For example, the liver content of MG is increased in diabetic mice and in rats with CCl4-induced hepatitis [12, 13].
MG has been related to the onset and progression of many metabolic disorders that modify the hepatic energy metabolism in different ways, including modifications in opposite directions, i.e., stimulus of anabolic pathways in some diseases and catabolic ones in other conditions. MG is related to the progression of obesity, diabetes and MASLD, all of these linked to stimulation of hepatic anabolic pathways, such as gluconeogenesis and lipid synthesis [14]. In contrast, MG is also related to the development of steatohepatitis and cirrhosis, which are linked to stimulation of catabolic pathways in the liver and systemically [15]. The latter are associated with reduction of hepatic gluconeogenesis and glycogen stores, stimulus of lipolysis, anorexia and cachexia [15, 16]. In this regard, high circulating levels of MG are associated with advanced cirrhosis and systemic inflammation [17]. In fact, high-grade inflammation has been reported to be the major driver of cirrhosis and liver failure [18]. In addition, high-grade systemic inflammation is related to a widespread catabolism in the body, including stimulus of catabolic pathways in the liver [19-21].
Although the role of MG in chronic liver disease has been extensively investigated, not much has yet been done to clarify the effects of this glycotoxin on energy metabolism in healthy liver cells. Investigations of this kind can help to distinguish between the metabolic modifications that are elicited by disease and those ones caused solely by MG. To fill this gap was the purpose of the present work. MG was intraperitoneally administered to rats and metabolic pathways were measured in the isolated perfused liver (glycogen catabolism, gluconeogenesis and ketogenesis) as well in adipose tissue. It was in addition evaluated the respiratory activity in isolated hepatic mitochondria and the influence of MG and AGE on the viability of lymphocytes. Additional mechanistic insights were gained by measuring enzyme activities, mRNA expression of key enzymes, cytokines and RAGE and the contents of AGE, MG and oxidative state markers.
Materials and Methods
Materials
Methylglyoxal
(MG), bovine serum albumin (BSA), enzymes and coenzymes were
purchased from Sigma Chemical Co (St. Louis, MO, USA).
Anti-phospho-AMPK and anti-AMPK antibodies
were purchased from Cell Signaling Technology®
(Danvers, MA, USA). Anti-β-actin
antibody was purchased from Santa Cruz Biotechnology (Santa Cruz, CA,
USA). Anti-carboxymethyllysine and
anti-methylglyoxal antibodies were purchased from Abcam (Cambridge,
UK). Chemiluminescence AmershamTM
ECL Prime reagent was purchased from GE Healthcare (Chicago, IL,
USA). TrizolTM
reagent and QuantiNova®
Reverse Transcription Kit was purchased from Thermo Fisher Scientific
(Waltham, MA, USA). Commercial kits for
AST, ALT, albumin, total protein, glucose,
triglycerides (TAG), total cholesterol (CHOL) and HDL CHOL
were purchased from Gold Analisa Diagnóstica Ltda (Belo Horizonte,
MG, Brazil). The ELISA kit for MG assay was purchased from ELK
Biotechnology Co (Denver, CO, USA).
Animal housing and experimental design
Male
Wistar
rats weighing 180-220g (50 days old) were obtained from the Central
Animal Facility of the State University of Maringá (UEM). The
animals were housed in polypropylene cages (four animals per cage)
under controlled temperature (24 ± 3 ºC) with 12-hour light/dark
lighting cycles and free access to standard diet (Nuvilab®,
Colombo, PR, Brazil) and water. All procedures were performed as
recommended by the Brazilian National Council for the Control of
Animal Experiments (CONCEA) and were approved by the Ethics
Commission in for the Use of Animals (CEUA) of UEM (Protocol Number
9185221019).
In the
acute approach, animals were randomly distributed into three groups
(n = 7 per group): control rats (Co), which received 5 mL/kg of 0.9%
saline; rats MG100 and MG200, which received 100 and 200 mg/kg MG,
respectively. MG (or saline) was administered through intraperitoneal
injection for seven consecutive days. In
the chronic approach, animals received saline (vehicle) or 25 mg/kg
MG by intraperitoneal injection for one month. The chronic approach
was carried out to evaluate the effects of long-term exposure to MG.
Body weight and food consumption were monitored every 2 days. The
doses and frequency of administration for MG were based on previous
studies [22-25] and they are required to maintain a stabilized MG
concentration in the plasma at approximately three times greater than
the baseline [25].
Such MG levels align with those found in pathological conditions [1,
2,17].
Evaluation of glucose homeostasis
Glycemic
homeostasis was evaluated by measuring fasting blood glucose levels,
and by performing oral glucose tolerance tests (OGTT) and insulin
tolerance tests (ITT). OGTT was performed
by oral administration (gavage) of glucose (1.5 g/kg) to 12 h fasted
rats. At appropriate times, blood samples were taken after tail
incision and glucose was measured using a glucometer (AccuChek
Active®,
Roche). Fasting glycemia corresponds to the blood glucose levels just
before glucose administration. The ITT was
performed by an intraperitoneal injection of regular insulin (1 U/kg)
in rats fasted for 12 h followed by blood glucose measurements at
times 0, 5, 10, 15, 20, 25 and 30 min. The
kITT
values were calculated as the slopes of the linear segment of the ITT
curves.
Tissue collection and processing
Rats
fasted for 12 h were deeply anesthetized by intraperitoneal injection
of a combination of xylazine (9 mg/kg) and ketamine (90 mg/kg).
Afterwards the peritoneal cavity was exposed and blood was collected
from the cava vein for obtaining the plasma fraction. Next, the liver
was removed and divided into two portions: one was processed for
evaluation of proteins expression, enzymes activities and subcellular
organelles isolation. The other liver portion was immediately frozen
in liquid nitrogen for assessment of hepatic lipids, MG and oxidative
stress. Finally, the retroperitoneal, periepididymal and mesenteric
white fat depot and the gastrocnemius and soleus muscles were removed
and weighed. Subsequently, fat depots were snap frozen for western
blot analysis.
For
assessment of lipids and oxidative stress,
the frozen portion of tissue was
homogenized in a Van Potter-Elvehjem homogenizer with 10 volumes of
ice-cold 0.1 M potassium phosphate buffer (pH 7.4). An aliquot was
separated for use as total homogenate, and the remaining portion was
centrifuged at 11, 000g
by 15 min. The supernatant separated as a
soluble fraction
of the homogenate. For assessment of MG,
liver was homogenized in ice-cold PBS (PBS;
pH 7.4) and centrifuged at 10, 000g for
10 min. The supernatant was collected and used to MG determination by
ELISA.
Adipocytes isolation and analysis
Adipocytes
from the retroperitoneal, periepididymal and mesenteric fat pads were
isolated as previously described [26]. Briefly, adipose tissue was
removed, minced with scissors, the fragments placed in a digestive
buffer (pH 7.4) containing collagenase II and incubated at 37ºC for
60 min under gentle agitation. The digested tissue was filtered,
washed with Earle/Hepes buffer (EHB; pH 7.4) and the cells
resuspended in this medium. After resting for 30 min, the infranatant
was aspirated and the decanted adipocytes resuspended with
paraformaldehyde for morphometric analysis. Images were captured by
optical microscopy (Nikon Eclipse E110®,
Tokyo, Japan) at 20x magnification. Five images per animal were
captured and the area of 10 adipocytes per image was measured,
resulting in 50 adipocytes/animal. The areas of adipocytes were
determined using the ImageJ®
software (National Institute of Health – NIH).
Plasma analytical assays
The
levels of total and HDL CHOL, TAG, total protein, albumin, MG and AST
and ALT activities were determined in the plasma using commercial
kits. The myeloperoxidase (MPO) activity was determined by
spectrophotometry (460 nm) with o-dianisidine [27]. The levels of
glycerol were determined by spectrofluorimetry (λex
= 350 nm and λem
= 465 nm) using glycerol dehydrogenase [28]. This method relies on
the fluorescence of NADH formed from NAD+
when glycerol is oxidized to dihydroxyacetone in the reaction
catalyzed by glycerol dehydrogenase. The levels of β-hydroxybutyrate
and acetoacetate were quantified by spectrophotometry using
β-hydroxybutyrate dehydrogenase (340 nm)
[29]. Maillard compounds (AGE levels) were assayed by
spectrofluorimetry (λex =
370 nm and λem =
440 nm) [30].
Oxidative stress parameters
Oxidative
stress was assessed in the plasma and liver. The ferric reduction
capacity of plasma (FRAP) was determined by spectrophotometry (593
nm) [31]. Total antioxidant capacity (TAC) of the plasma was assayed
by colorimetric method using 2, 2'-azinobis
(3-ethylbenzothiazoline-6-sulfonic acid) or ABTS [32]. The content of
protein sulfhydryl groups (thiols) was determined in plasma by
spectrophotometry (412 nm) using 5, 5'-dithiobis(2-nitrobenzoic acid)
(DTNB) [32]. The levels of protein carbonyl groups were determined in
plasma and supernatant of liver homogenate by spectrophotometry with
2, 4-dinitrophenylhydrazine (DNPH) [33]. The contents of reduced
(GSH) and oxidized (GSSG) glutathione were determined in the liver
homogenate by spectrofluorimetry (λex
= 350 nm and λem
= 420 nm)with o-phthalaldehyde (OPT) [34]. Reactive oxygen species
(ROS) was quantified in the supernatant of homogenate by
spectrofluorimetry (λex=
504 nm and λem
= 529 nm) using 2, 7-dichlorofluorescein diacetate (DCFH-DA) [35].
The catalase activity was estimated in the supernatant of liver
homogenate by measuring changes in absorbance at 240 nm using H2O2
as substrate [29]. The activity of superoxide dismutase (SOD) was
estimated spectrophotometrically (420 nm) by its ability to inhibit
the pyrogallol autoxidation in alkaline medium [36]. The expression
in terms of mRNA of catalase, glutathione reductase (GR),
glutathione S-transferase alpha 3 (GSTA3),
glutathione peroxidase-1 (GPx1) and heme oxigenase 1 (HO-1) were
determined by RT-PCR.
Hepatic lipids and AGE content
Total
lipids were extracted from frozen livers with a chloroform-methanol
mixture (2:1) and quantified by a gravimetric method [20]. The
extracted lipids were dissolved in a chloroform-isopropanol mixture
(1:2) for quantifying TAG and CHOL using commercial kits. AGE levels
were quantified in the liver homogenate, which was centrifuged at 16,
000g for 1 hour. The supernatant was separated, diluted 10×, and
Maillard compounds were assayed in the same way as in plasma [30].
Liver perfusion and metabolism
Hemoglobin-free
non-recirculating liver perfusion was performed as earlier described
[37]. Rats were deeply anesthetized by an
intraperitoneal injection of xylazine (9 mg/kg) plus ketamine (90
mg/kg) and the
peritoneal cavity was exposed by
laparotomy. After
cannulation of the portal and cava veins, the liver was removed and
positioned in a plexiglass chamber. The perfusion fluid was
Krebs/Henseleit-bicarbonate buffer (pH 7.4) containing 25 mg% BSA and
saturated with a mixture of oxygen and carbon dioxide (95:5) by means
of a membrane oxygenator with simultaneous temperature adjustment at
37 ºC. The flow was maintained constant by a peristaltic pump
(Minipuls 3, Gilson, France). Oxygen
concentration in the venous perfusate was monitored by a
teflon-shielded platinum electrode. Samples of the venous perfusate
were collected at two minutes intervals and analyzed for their
metabolites contents.
Glycolysis
and glycogenolysis were measured in livers isolated from fed rats,
which were perfused with the perfusion fluid in the absence of
exogenous substrates [38]. Glucose, lactate and pyruvate were assayed
in the effluent perfusate by standard enzymatic procedures [29].
Glucose was measured by spectrophotometry (505 nm) using the
enzymatic-colorimetric glucose oxidase method. Lactate and pyruvate
were assayed by spectrophotometry using the lactate dehydrogenase
reaction. At the steady-state, glycolysis was defined as (lactate +
pyruvate)/2 and glycogenolysis = glucose + [(lactate + pyruvate)/2].
Gluconeogenesis
was measured in the livers of 12 h fasted rats and L-lactate (2 mM)
or D-glycerol (5 mM) was infused as a glucose precursor [39]. The
livers were initially perfused with Krebs/Henseleit buffer in the
absence of exogenous substrates. After stabilization of oxygen
consumption, L-lactate (2 mM) or glycerol (5 mM) was added to the
perfusion fluid by 30 min. Glucose, lactate and pyruvate were assayed
in the effluent perfusate [29].
Ketogenesis
was measured in the livers of 12 h fasted rats and palmitic acid (0.3
mM) was used as substrate [40].
Acetoacetate and β-hydroxybutyrate were
assayed in the effluent perfusate [29].
Liver mitochondria and microsomes isolation
Fresh
livers were placed in a medium containing
200 mM mannitol, 75 mM sucrose, 0.2 mM ethylene glycol tetraacetic
acid (EGTA), 2 mM Tris–HCl, pH 7.4 and 50 mg/dL BSA. The organ was
minced, washed and homogenized in the same medium with a Van
Potter-Elvehjem homogenizer. Hepatic mitochondria and microsomes were
isolated by differential centrifugation: 600g
(10 min) and 7, 000g
(10 min) for mitochondria [41]; the supernatant was then centrifuged
at 12, 400g
(10 min), the supernatant was collected and centrifuged again at 105,
000g (60
min). The resulting pellet was the microsomal fraction [42].
Mitochondria respiration and membrane potential (MMP)
Mitochondrial
oxygen consumption was measured by polarography using a
teflon-shielded platinum electrode as earlier described [43].
Isolated mitochondria were incubated in the closed oxygraph
chamber with the respiration medium (2.0 mL). The substrates were 10
mM succinate or α-ketoglutarate. Rates of
oxygen consumption were computed from the slopes of the recorder
tracings. The respiration rates were measured under three conditions:
Before the addition of ADP (basal respiration), just after 0.125 mM
ADP addition (state III respiration) and after cessation of the ADP
stimulation (state IV). The respiratory control (RC) was the ratio of
state III/state IV and the ADP/O ratio was calculated as earlier
described [44].
Freeze-thawing
disrupted mitochondria were used to measure the activities of
succinate-oxidase and NADH-oxidase by polarography. Disrupted
mitochondria were incubated in the respiration medium (20 mM
Tris-HCl, pH 7, 4) and the reaction was started by the addition of
substrates, 1 mM NADH and 1 mM succinate, for NADH-oxidase and
succinate-oxidase, respectively. The couple TMPD-ascorbate was in
addition used as electron donating substrate to cytochrome c/complex
IV of the mitochondrial respiratory chain.
MMP
was measured by spectrofluorimetry (λex
= 520 nm and λem
= 580 nm) using the dye safranin [45].
Mitochondria (1 mg protein) were incubated in a medium (2mL)
containing 0.25 M mannitol, 5 mM potassium phosphate, 10 mM Tris (pH
7.4), 0.2 mM EGTA, 50 mg% BSA and 10μM
safranin. The latter accumulates in polarized mitochondria. The
energization was achieved with 50 μM
succinate and after, the complete depolarization was achieved with 10
μM carbonyl cyanide
4-(trifluoromethoxy)phenylhydrazone (FCCP). The MMP was calculated by
subtracting the fluorescence obtained with FCCP from that one
obtained with succinate and expressed as arbitrary fluorescence units
(AFU).
Hepatic gluconeogenic enzymes activity
The
activity of glucose 6-phosphatase (G6Pase) was measured in isolated
microsomes by the spectrophotometric quantification of the released
phosphate from glucose 6-phosphate [42]. The activities of fructose
1, 6-bisphosphatase (FBPase-1) and phosphoenolpyruvate carboxykinase
(PEPCK), glycerol-3-phosphate dehydrogenase (GPDH) and glycerol
kinase (GK) were determined using the supernatant of the
centrifugation at 105, 000g
that was obtained in the procedure of microsomes isolation (Section
2.10). The FBPase-1 activity was measured by the spectrophotometric
quantification of the released phosphate from fructose-1,
6-bisphosphate [40]. The PEPCK activity was estimated by coupling the
malate dehydrogenase to the PEPCK reaction [40]. The NADH oxidation
by oxaloacetate formed in the PEPCK reaction was assayed by
spectrophotometry (340 nm). The GK activity was performed with a
coupled assay with GPDH and GPDH activity was assayed by
spectrophotometry following the NADH oxidation at 340 nm [29].
Western Blot
Fresh
livers (50mg) or adipose tissues (100mg) were homogenized in a lysis
buffer (100 mM Tris/HCl, pH 7.5, 100 mM sodium pyrophosphate, 100 mM
sodium fluoride, 100 mM sodium orthovanadate, 2 mM PMSF, and
aprotinin 1mg/mL) and centrifuged at 12.000g
for 20 min. The pellet was discarded and the supernatant used for the
procedure. Total protein was determined as earlier [46]. Aliquots of
supernatant (30 μg protein) were added to
Laemmli buffer, heated at 100 °C for 5 min, applied on 10% SDS-PAGE
and transferred to a nitrocellulose membrane overnight (20 V). The
membranes were then submitted to blocking buffer, and subsequently
incubated overnight at 4 °C with primary antibodies
(anti-phospho-AMPK, anti-AMPK and anti-β-actin).
Membranes were washed, incubated with
horseradish peroxidase-conjugated secondary
antibody and covered with chemiluminescence
detection Amersham ECL Prime reagent. The
bands were visualized using the ImageQuant LAS 500 (GE Healthcare
Life Sciences, Chicago, IL, USA) and intensities were analyzed using
ImageJ software (National Institute of Health, Maryland, USA).
Dot blot
A
liver sample (50 mg) was homogenized with lysis buffer, centrifuged
at 12.000g
for 20 min, the pellet discarded and the protein content measured in
the supernatant [46]. Aliquots of supernatant were added at the final
concentration of 3 µg/µL to Laemmli buffer, heated at 100 °C for 5
min and 3µL applied to an activated PVDF (polyvinylidene difluoride)
membrane. The dots were left to dry overnight and the membrane was
thereafter reactivated with methanol and stained with 0.025%
coomassie blue R-250 in 40% methanol and 7% acetic acid. The stained
membrane was washed 3 times with a destain solution composed by 50%
methanol and 7% acetic acid (v/v). The coomassie blue stain was
detected using ImageQuant LAS 500 (GE Healthcare Life Sciences,
Chicago, IL, USA) and used as a loading control. Coomassie blue was
thereafter completely removed with pure methanol from the membrane,
which was washed in TBS-T solution and incubated in TBS-T blocking
reagent. The membranes were then incubated overnight at 4 °C with
primary antibodies: anti-methylglyoxal (anti-MG) diluted 1:1000 or
anti-carboxymethyllysine (anti-CML) diluted 1:2000 and in the next
day with a secondary antibody anti-mouse diluted 1:5000. Membranes
were gently washed, incubated with horseradish
peroxidase-conjugated secondary antibody
and covered with chemiluminescence detection Amersham ECL Prime
reagent. The bands were visualized using
the ImageQuant LAS 500 and the intensities were analyzed using the
same ImageJ software.
RNA isolation and real-time quantitative RT-qPCR
Liver
samples were collected and stored in liquid nitrogen for total RNA
extraction. RNA was isolated from 100 mg frozen tissue using Trizol
reagent. The RNA concentration was measured by spectrophotometry at
260 nm (NanoDrop ND 1000 NanoDrop Technologies, Wilmington, DE). The
integrity of RNA (RNA integrity number - RIN) was evaluated in
Bioanalyzer RNA 6000 (Agilent, USA). cDNA was synthetized using the
QuantiNova®
Reverse Transcription Kit and the quantitation of the tissue
expression of selected genes was done by quantitative PCR in a
Rotor-Gene®
Q (Qiagen) with
“HOT FirePol®
EvaGreen®
qPCR Supermix” (Solis BioDyne, EE). The GAPDH gene was utilized as
reference. The 2-∆CT method was used for the relative
quantification analysis and data were expressed in arbitrary units
(AU). Primer sequences of all genes are
presented as Supplemental Material (Table S1).
Volunteers, human lymphocytes isolation and primary lymphocyte culture
Venous
blood was collected from four healthy male volunteers aged between 20
and 30 years, non-smoker, with no historical of chronic diseases and
who did not use prescription drugs. The procedure was
performed in accordance with the Code of Ethics of the World Medical
Association (Declaration of Helsinki) and
approved by the Human Ethics Committee of the State University o
Maringá (Application n° 70612823.1.0000.0104). Blood was collected
using a 20mL heparinized disposable syringe. Peripheral lymphocytes
were isolated as previously described [47], with modifications. Blood
was distributed in Falcon tubes and diluted in a 1:1 ratio with
sterile 0.85% saline. After another dilution with Ficoll Paque Plus
(1:3 v/v), the tubes were centrifuged at 1500 rpm for 30 min to
separate blood into plasma, red cells and white cells. The buffy coat
(leukocytes) was collected, diluted in Hanks solution (3:1) and
centrifuged at 1100 rpm for 10 minutes. The supernatant was discarded
and the procedure repeated once more to wash the cells. Next, the
cell pellet was resuspended in 1mL of RPMI medium supplemented with
20% FBS (Gibco) and 2% phytohemagglutinin A (Gibco), and the cells
were counted in a Neubauer chamber. Lymphocyte cultures were grown in
96-well plates containing RPMI medium supplemented with
phytohemagglutinin A and SBF, in an oven at 37ºC and humidified
atmosphere.
AGE preparation and lymphocytes viability assay
AGEs
were obtained by incubating 50 mg/mL albumin (BSA) with 50 mM
MG (AGE-L) or 250 mM MG (AGE-H) in 1 M sodium
phosphate buffer (pH 7.4) at 50 °C for 4 days under sterile
conditions. After this period, the solutions were filtered (0.22 µm)
and dialyzed against 0.1 M PBS, pH 7.4 at 4 ºC for 24 h [48]. Next,
the solution was again filtered, aliquoted and stored at -80ºC. The
AGE preparations were characterized in relation to non-oxidized amino
acids, Maillard compounds, protein carbonyl and sulfhydryl groups,
N-oxidized of amino acids, and contents of carboxymethyllysine
(CML) and methylglyoxal-hydroimidazolone 1 (MG-H1).
The results of AGE characterization are presented as Supplementary
material (Fig. S1).
The
viability of human lymphocytes was evaluated using the MTT (3-(4,
5-dimethylthiazol-2-yl)-2, 5-diphenyltetrazolium bromide) assay, on
the basis of the cellular conversion of tetrazolium salt into
formazan. Cells were seeded at a density of
106
cells per mL in 96-well plates and allowed to grow for 24 or 48 h at
37 °C in the presence of AGE-L or AGE-H at the concentrations of
0.1, 1 and 2.5 mg/mL. Such AGE
concentrations were based on a previous study [48]. Additional
groups of lymphocytes were incubated under the same conditions with
MG at concentrations in the range of 5-2000 µM. Following this
incubation period, cells were washed with PBS and incubated with MTT
(0.5 mg/mL) for 2 h. The MTT medium solution was removed, formazan
crystals were solubilized by adding DMSO (100 µL/well) and the
absorbance of the solution was measured at 550 nm. Five independent
experiments were conducted, and the results are presented as
percentage of controls, to which 100% activity was attributed [49].
Statistical analysis
Results are expressed as
mean ± standard error of the mean (SEM). Statistical analysis was
done using GraphPad Prism Software (version 8.0). For three or more
values, the statistical significance of the data was analyzed by
means of ANOVA ONE-WAY, and a Newman Keuls posthoc test was
applied with the 5% level (p < 0.05). For the comparison of two
values, the student t-test was applied with the 5% and 1%
level (p < 0.05 and p < 0.01).
Results
MG impairs the body weight gain and decreases the food intake
In
order to evaluate if MG administration affects the body weight and
food intake, these parameters were monitored every 2 days. The
results are shown in Fig. 1. The body weight gain was diminished by
the MG administration in a dose-dependent manner over the entire
seven-day treatment period (Fig. 1A). After 7 days, the weight of the
rats that received 100 and 200 mg/kg was 40% and 56% lower,
respectively, compared to the controls (Fig. 1B). The daily food
intake was lower in the group that received 100 mg/kg MG and even
lower in the group that received 200 mg/kg MG (Fig. 1C). The average
daily food intake over a week was 20% and 52% lower in the groups
that received 100 and 200 mg/kg MG, respectively. (Fig. 1D). Rats
that received MG at the lower dose of 25 mg/kg during one month
(MG25), also slowed down weight gain when compared to the controls,
but the phenomenon was much less pronounced and occurred only from
the 10th
day on (Fig. 1E). After a month of exposure to 25 mg/kg MG, a 20%
reduction in body weight was observed when compared to the controls
(Fig. 1F). The daily food intake for the group that received 25 mg/kg
MG during the treatment period was not different from that of the
controls (Fig. 1F). The last observation suggests that reduction in
food intake may not be the sole cause of the reduction in weight gain
caused by the glycotoxin.
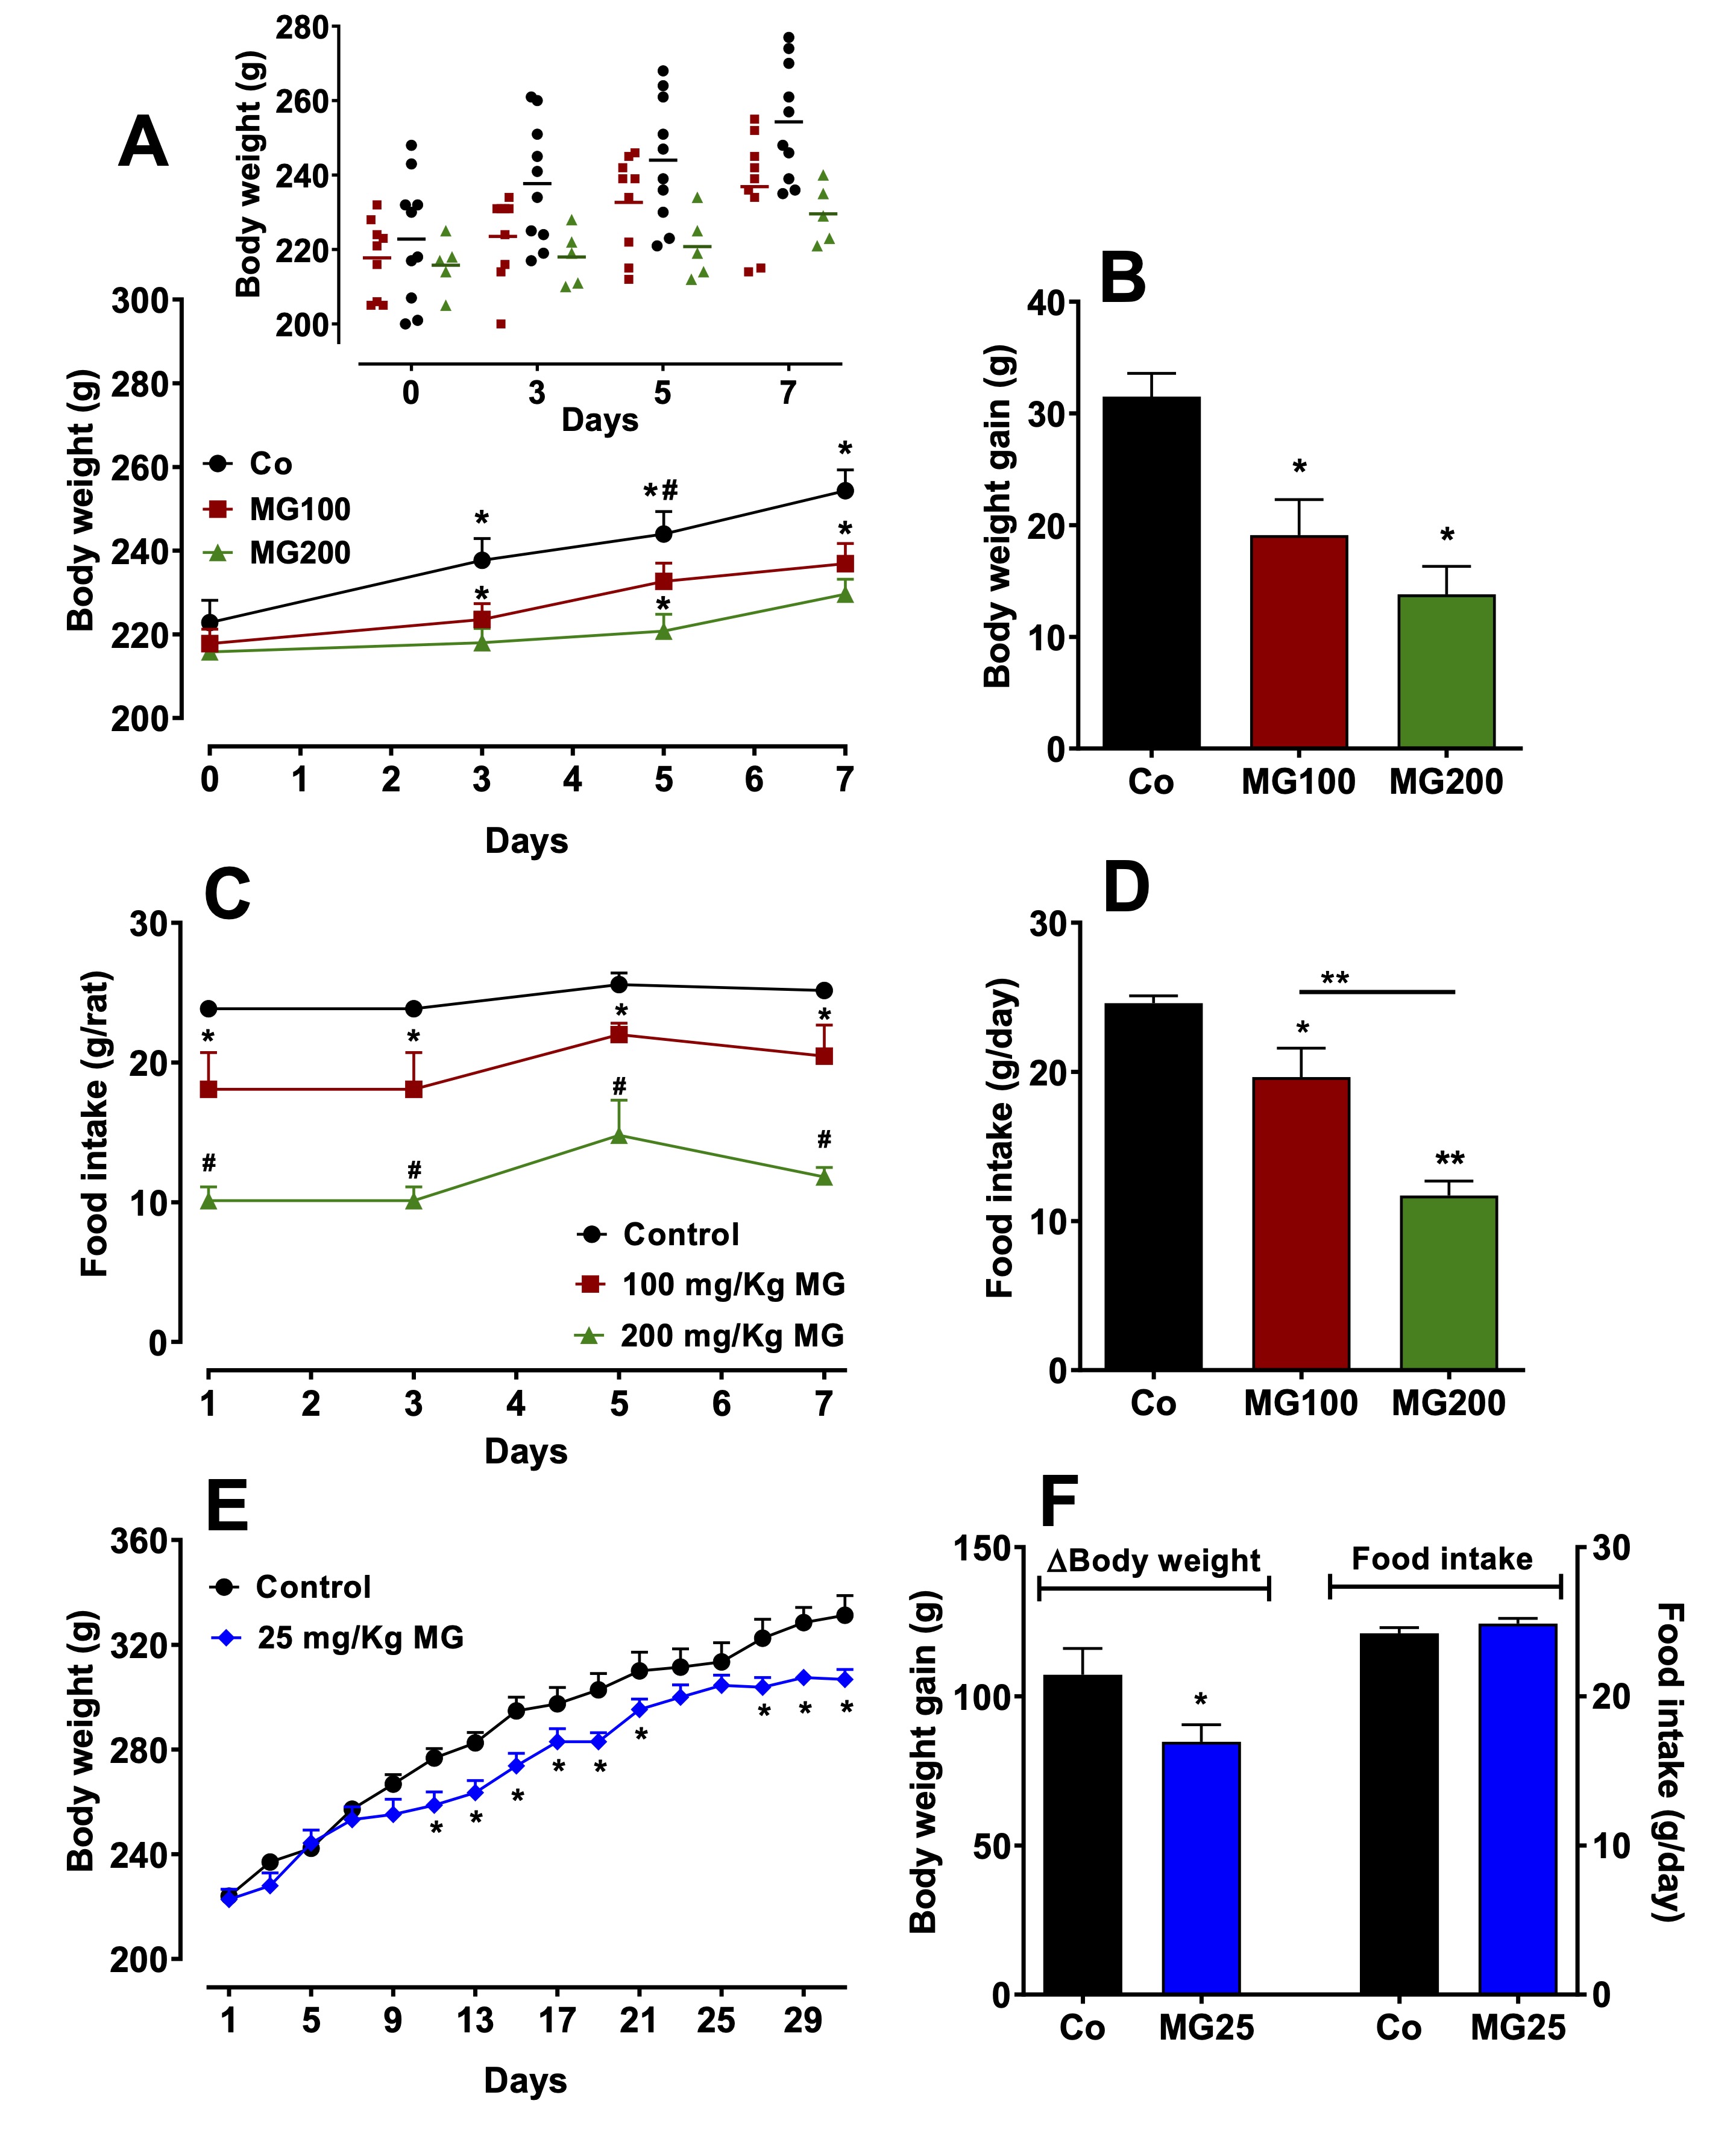
Fig. 1: Effects of methylglyoxal (MG) on body weight and food intake of rats. The animals received daily i.p. saline (Co; Control), 100 mg/kg (MG100) or 200 mg/kg (MG200) MG for 7 days or 25 mg/kg MG (MG25) for one month. A: Evolution of body weight during 7 days. The insert in Panel A shows the individual body weights as a scatter plot. B: Body weight gain during 7 days. C: Daily food intake evolution during 7 days. D: Daily food intake average of 7 days. E: Evolution of body weight for one month. F: Body weight gain in one month and daily food intake mean of one month. Values are the mean ± SEM of 6-8 animals. *p<0.05 and **p<0.0001: different from Co; #p<0.05: difference between MG100 and MG200.
MG modifies the pattern of body fat deposition and causes loss of lean mass
Given
that MG affected body weight gain, body composition in terms of fat
and muscle mass was analysed. These results and the areas of the
adipocytes are shown in Fig. 2. MG at the dose of 100 mg/kg did not
modify the weight of periepididymal and retroperitoneal fat, but at
the dose of 200 mg/kg it decreased the weight of both fats by 32% and
56%, respectively (Fig. 2A). On the other hand, MG (100 and 200
mg/kg) increased the weight of mesenteric fat by 75%. The
administration of 25 mg/kg MG for one month did not modify the weight
of the adipose tissues (Fig. 2B). MG at the doses of 100 and 200
mg/kg decreased the gastrocnemius muscle weight by 6% and 20%,
respectively (Fig. 2C). Only 200 mg/kg MG decreased the weight of the
soleus muscle (-22%). The administration of 25 mg/kg MG for one month
did not modify the weight of the muscles (Fig. 2C). In order to
clarify the different profiles of the fat pads, the adipocytes were
isolated from these depots, and their size was analysed. Fig. 2E
shows representative optical microscopy images of adipocytes isolated
from each of the three adipose tissues obtained from the groups that
receive saline (control), 100 mg/kg (MG100) and 200 mg/kg MG (MG200).
The adipocytes areas obtained from these images are shown in Fig. 2D.
In the adipocytes from the retroperitoneal fat, both doses, 100 and
200 mg/kg, decreased their areas by 17% and 45%, respectively (Fig.
2D). Only the 200 mg/kg dose modified the area of the adipocytes from
periepididymal fat (-28%). Finally, the areas of the adipocytes from
mesenteric fat were increased by 86% and 22% by the doses of 100 and
200 mg/kg, respectively. Muscle loss evidences a more accelerated
catabolic state in animals that received MG, while the loss of the
periepididymal and retroperitoneal adipose mass is associated with
the reduction in the area of adipocytes. However, adipocytes from
mesenteric adipose mass exhibited hypertrophy. Together, these finds
show that the administration of MG promoted a redistribution of fatty
tissue without changing the total fat mass.
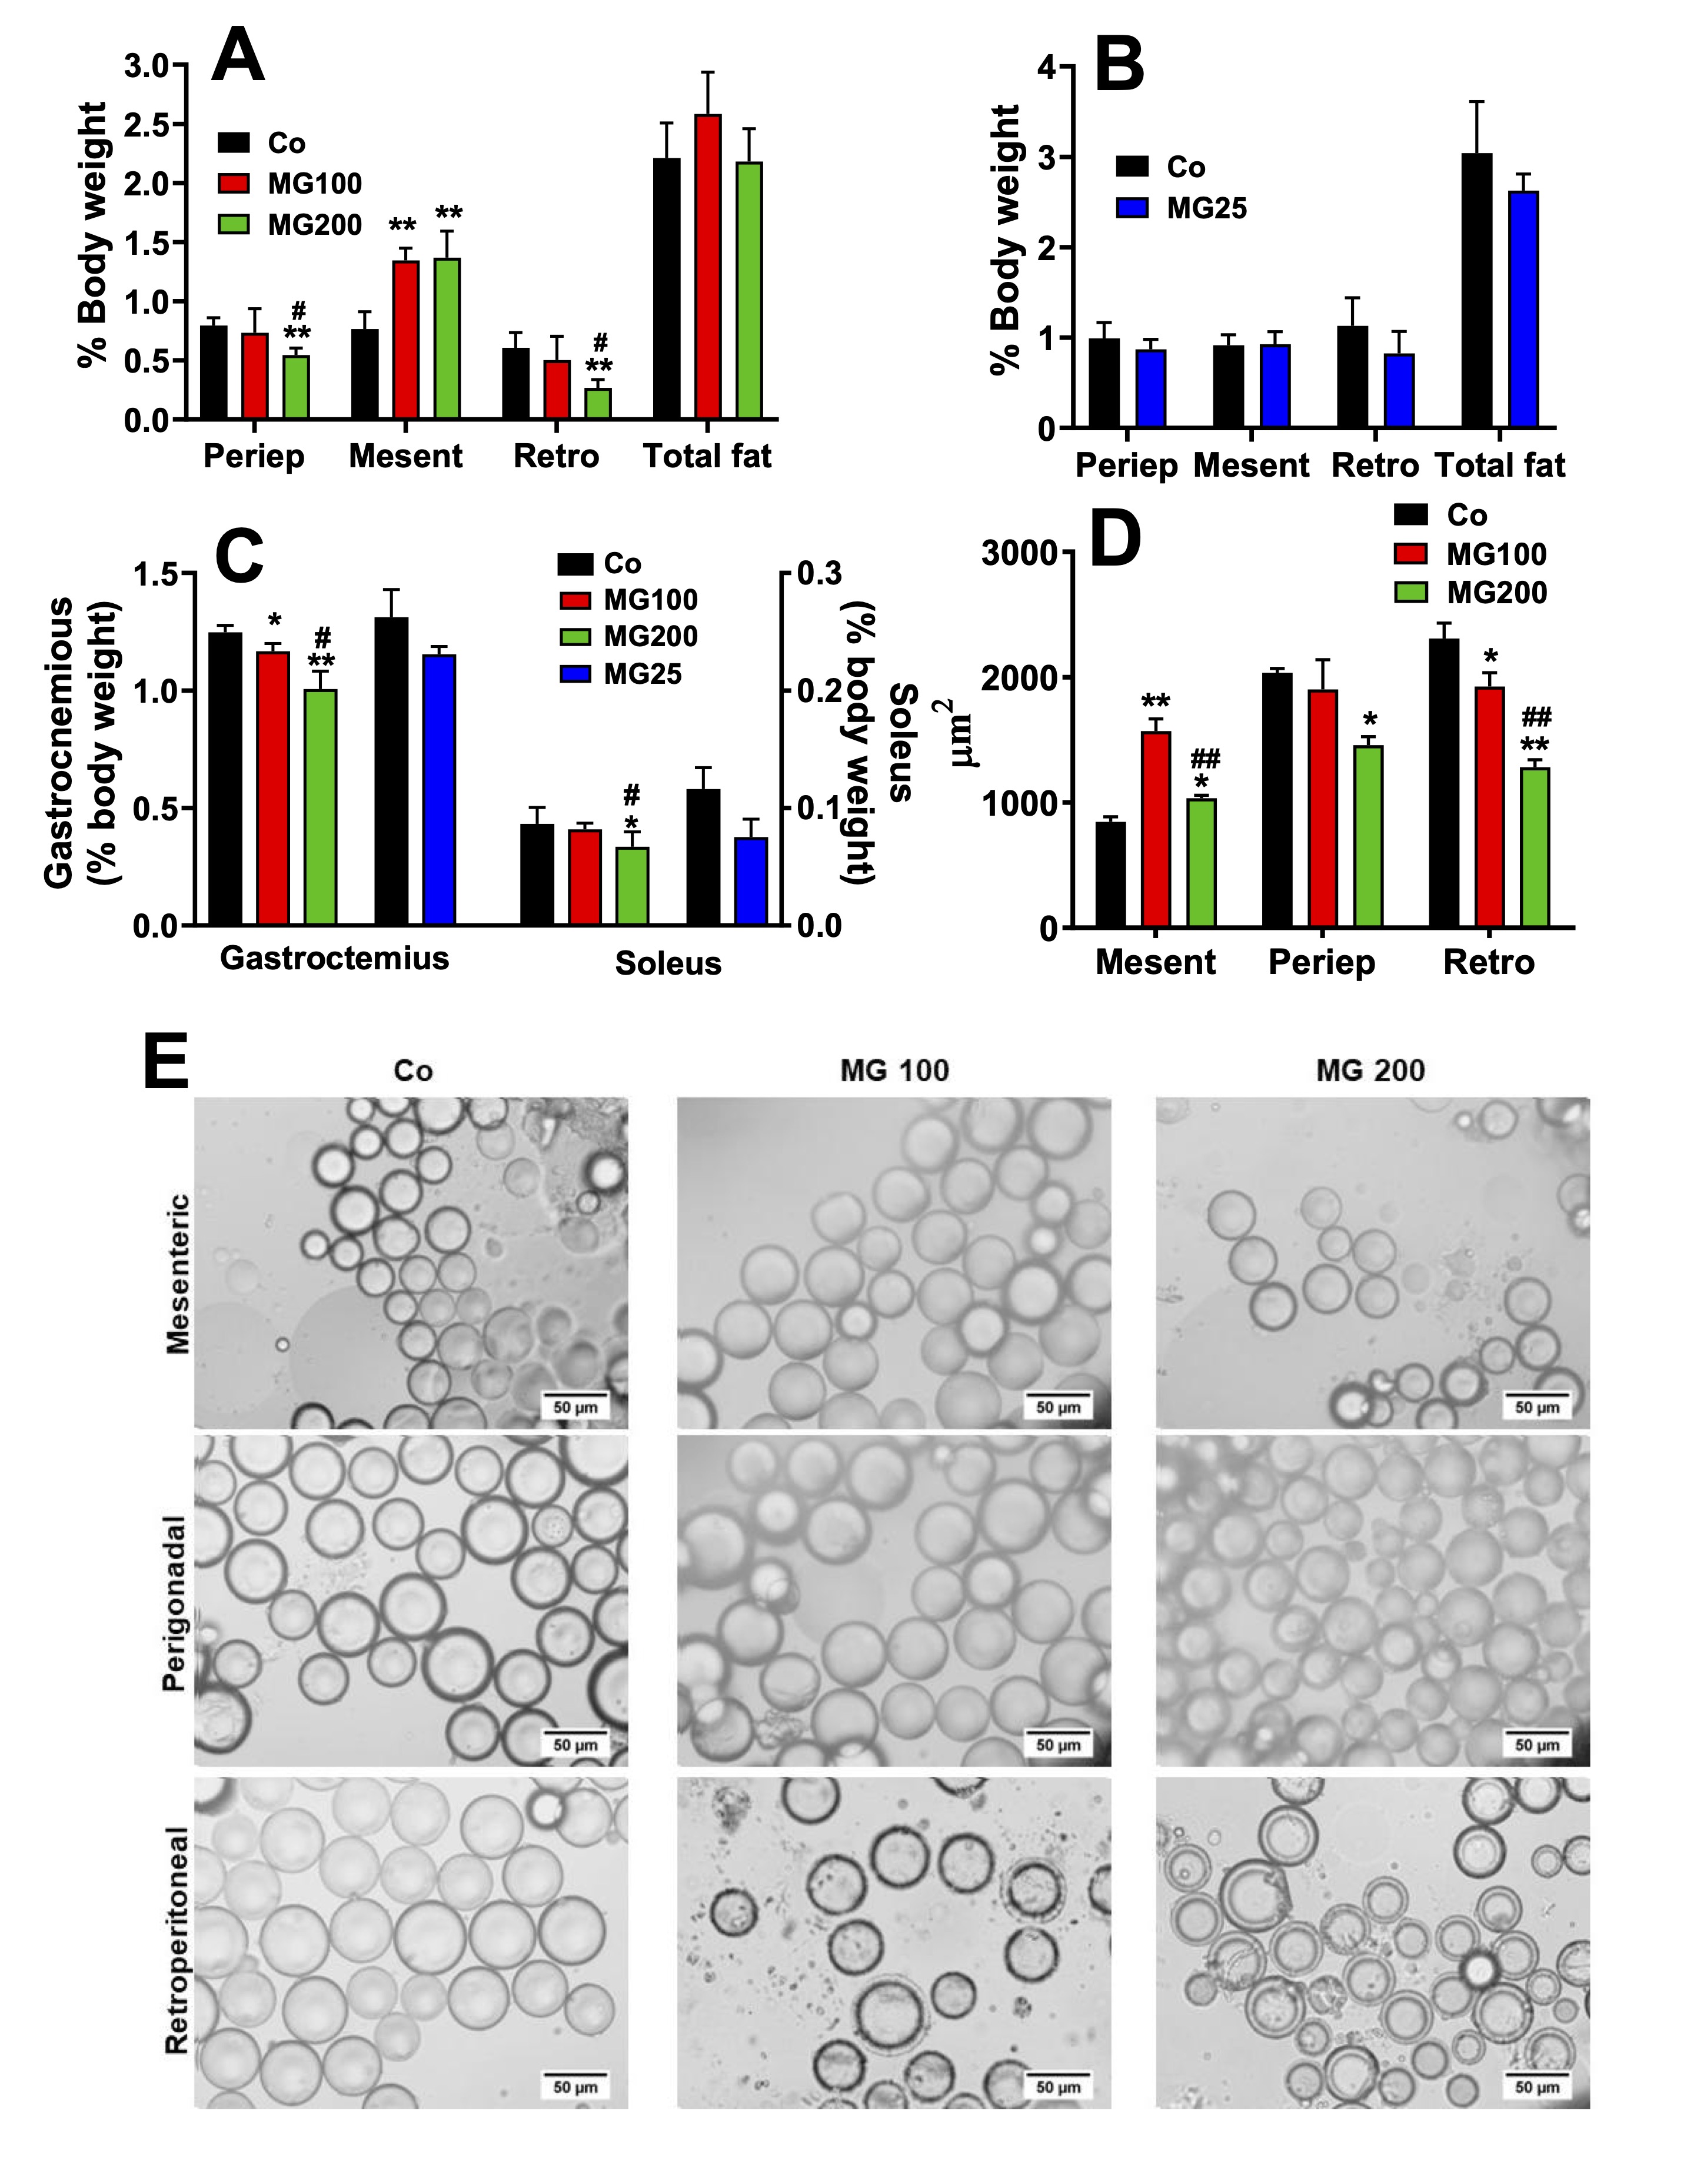
Fig. 2: Biometric parameters and morphometric analysis of adipocytes. The animals received i.p. saline (Co), 100 or 200 mg/kg MG (MG100 and MG200) for 7 days or 25 mg/kg MG (MG25) for one month. A and B: Adipose tissues weight of rats that received MG for 7 days and one month, respectively. C: Muscles weight. D: Adipocytes area in μm2. E: Optical photomicrographs of adipocytes isolated from retroperitoneal (Retro), mesenteric (Mesent) and periepididymal (Periep) adipose tissues. Tissues weights are expressed as % of body weight and they are mean ± SD of 4-8 animals. *p<0.05 and **p<0.0001: different from Co; #p<0.05 and ##p<0.0001: difference between MG100 and MG200.
MG decreases gluconeogenesis and downregulates key enzymes in the liver
In
order to evaluate if a catabolic state is present in the liver, the
next step was investigating the effects of MG on hepatic pathways
involved in energy metabolism. The effect of MG on gluconeogenesis
was investigated in perfused livers using firstly lactate as a
precursor. This
compound is one of the main gluconeogenic substrates in humans and
rodents and in addition allows the
evaluation of
the complete gluconeogenic machinery from pyruvate up to glucose [38,
39]. Fig.
3A shows the time courses of glucose and pyruvate production and
oxygen uptake in perfused livers. These
results refer to rats which received saline (Co), 100 mg/kg MG
(MG100) or 200 mg/kg (MG200) for 7 days and also to rats which
received 25 mg/kg MG (MG25) for one month. The results of controls
(Co) which received saline for 7 days or one month were not
substantially different and were omitted from Fig. 3A. As noted, the
basal rates of glucose and pyruvate production were minimal and
similar for all groups. The basal rates of oxygen uptake were lower
in the liver of rats which received MG. After the onset of lactate
infusion glucose and pyruvate production and oxygen consumption were
differently stimulated in livers of controls and rats which received
MG. Fig. 2B, C and D allow comparing the
increments in each parameter upon 2 mM lactate infusion.
Compared to the controls the increment in glucose production,
corresponding to gluconeogenesis, was approximately 40% lower in
livers from rats that received 100 mg/kg and 200 mg/kg MG and 22%
lower in livers from rats that received 25 mg/kg MG. The response of
oxygen uptake was depressed by approximately 34% only in the group
that received 25 mg/kg MG. Pyruvate production (Fig. 2D) from lactate
was increased (65%) only in livers from rats that received 200 mg/kg
MG.
The
effects of 25 mg/kg MG on biometric parameters and hepatic
gluconeogenesis were in general lower (or even absent) than those of
100 and 200 mg/kg MG. For this reason, the subsequent evaluations
were carried out only with 100 and 200 mg/kg MG. Considering that MG
impaired the gluconeogenesis, we investigated the contribution of the
gluconeogenic rate-limiting enzymes for this phenomenon. The activity
of PEPCK and FBPase-1 were, respectively, 58% and 45% lower in livers
from rats that received 100 and 200 mg/kg MG (Fig. 3E and F). The
activity of G6Pase was 18% and 38% lower, respectively, in the groups
that received 100 and 200 mg/kg MG (Fig. 3G). The hepatic mRNA
expressions of PEPCK and FBPase-1 were, respectively, 41% and 48%
diminished in the animals which received 200 mg/kg MG (Fig. 3E and
F). The hepatic mRNA expression of G6Pase was 140% increase in the
liver from rats that received 200 mg/kg MG (Fig. 3G).
The
effect of MG on gluconeogenesis was also investigated in perfused
livers using glycerol as glucose precursor. Glycerol enters in an
upper point of the gluconeogenic pathway and it needs only a third of
the energy required to synthesize glucose from lactate. The reaction
of glycerol kinase is the only step that requires ATP for the
synthesis of glucose from glycerol. The use of glycerol as precursor
allows inferring if the inhibition of gluconeogenesis occurs in an
upper or lower point of the pathway. In addition, glycerol
in the liver undergoes both an anabolic energy-dependent conversion
into glucose and a catabolic breakdown into lactate and pyruvate.
Examination of the effects of MG on glycerol metabolism is, thus, an
opportunity for evaluating how the compound affects both kinds of
metabolism in a single experiment. Fig. 4A shows the time courses of
glucose, lactate and pyruvate productions and oxygen consumption in
perfused livers due to glycerol infusion. After the onset of glycerol
infusion, the glucose and lactate productions were differently
stimulated in the livers from controls and rats that received MG. The
increment of glucose output due to glycerol (gluconeogenesis) is
shown in Fig. 4B and it was approximately 40% lower in the liver from
rats that received 100 and 200 mg/kg MG (compared to the controls).
The glycerol infusion did not modify oxygen uptake in the liver of
all groups, but the basal rate of oxygen uptake of the group that
received 200 mg/kg MG was 20% lower than that observed in the
controls and rats that received 100 mg/kg MG (Fig. 4C). The pyruvate
production was a quite higher in the liver of rats that received 200
mg/kg MG, but there was not modified by glycerol. The lactate
production was 63% and 285% increased by glycerol in the livers from
the groups that received 100 and 200 mg/kg MG, respectively, when
compared to the controls (Fig. 4D). Therefore, gluconeogenesis from
glycerol was also impaired by MG, whereas oxidation to lactate plus
pyruvate was increased by this compound.
The
reactions catalyzed by glycerol kinase (GK) and glycerol-3-phosphate
dehydrogenase (GPDH) are key steps for introducing glycerol into
hepatic gluconeogenesis and glycolysis. Stimulation of these enzymes
could be the cause of the increased lactate production from glycerol
in the liver of rats receiving MG. Indeed, MG has been shown to
increase GPDH activity in yeast [50]. Thus, the activity and mRNA
expression of GK and GPDH were evaluated in rats receiving MG at 200
mg/kg and in control rats. The results are shown in Fig. 4E and 4F.
These parameters were not significantly altered by MG, except for a
slight reduction in GPDH mRNA expression, without affecting its
activity. This indicates that a downstream event in these reactions
may be stimulating glycerol oxidation and lactate accumulation in the
liver of rats that received MG.
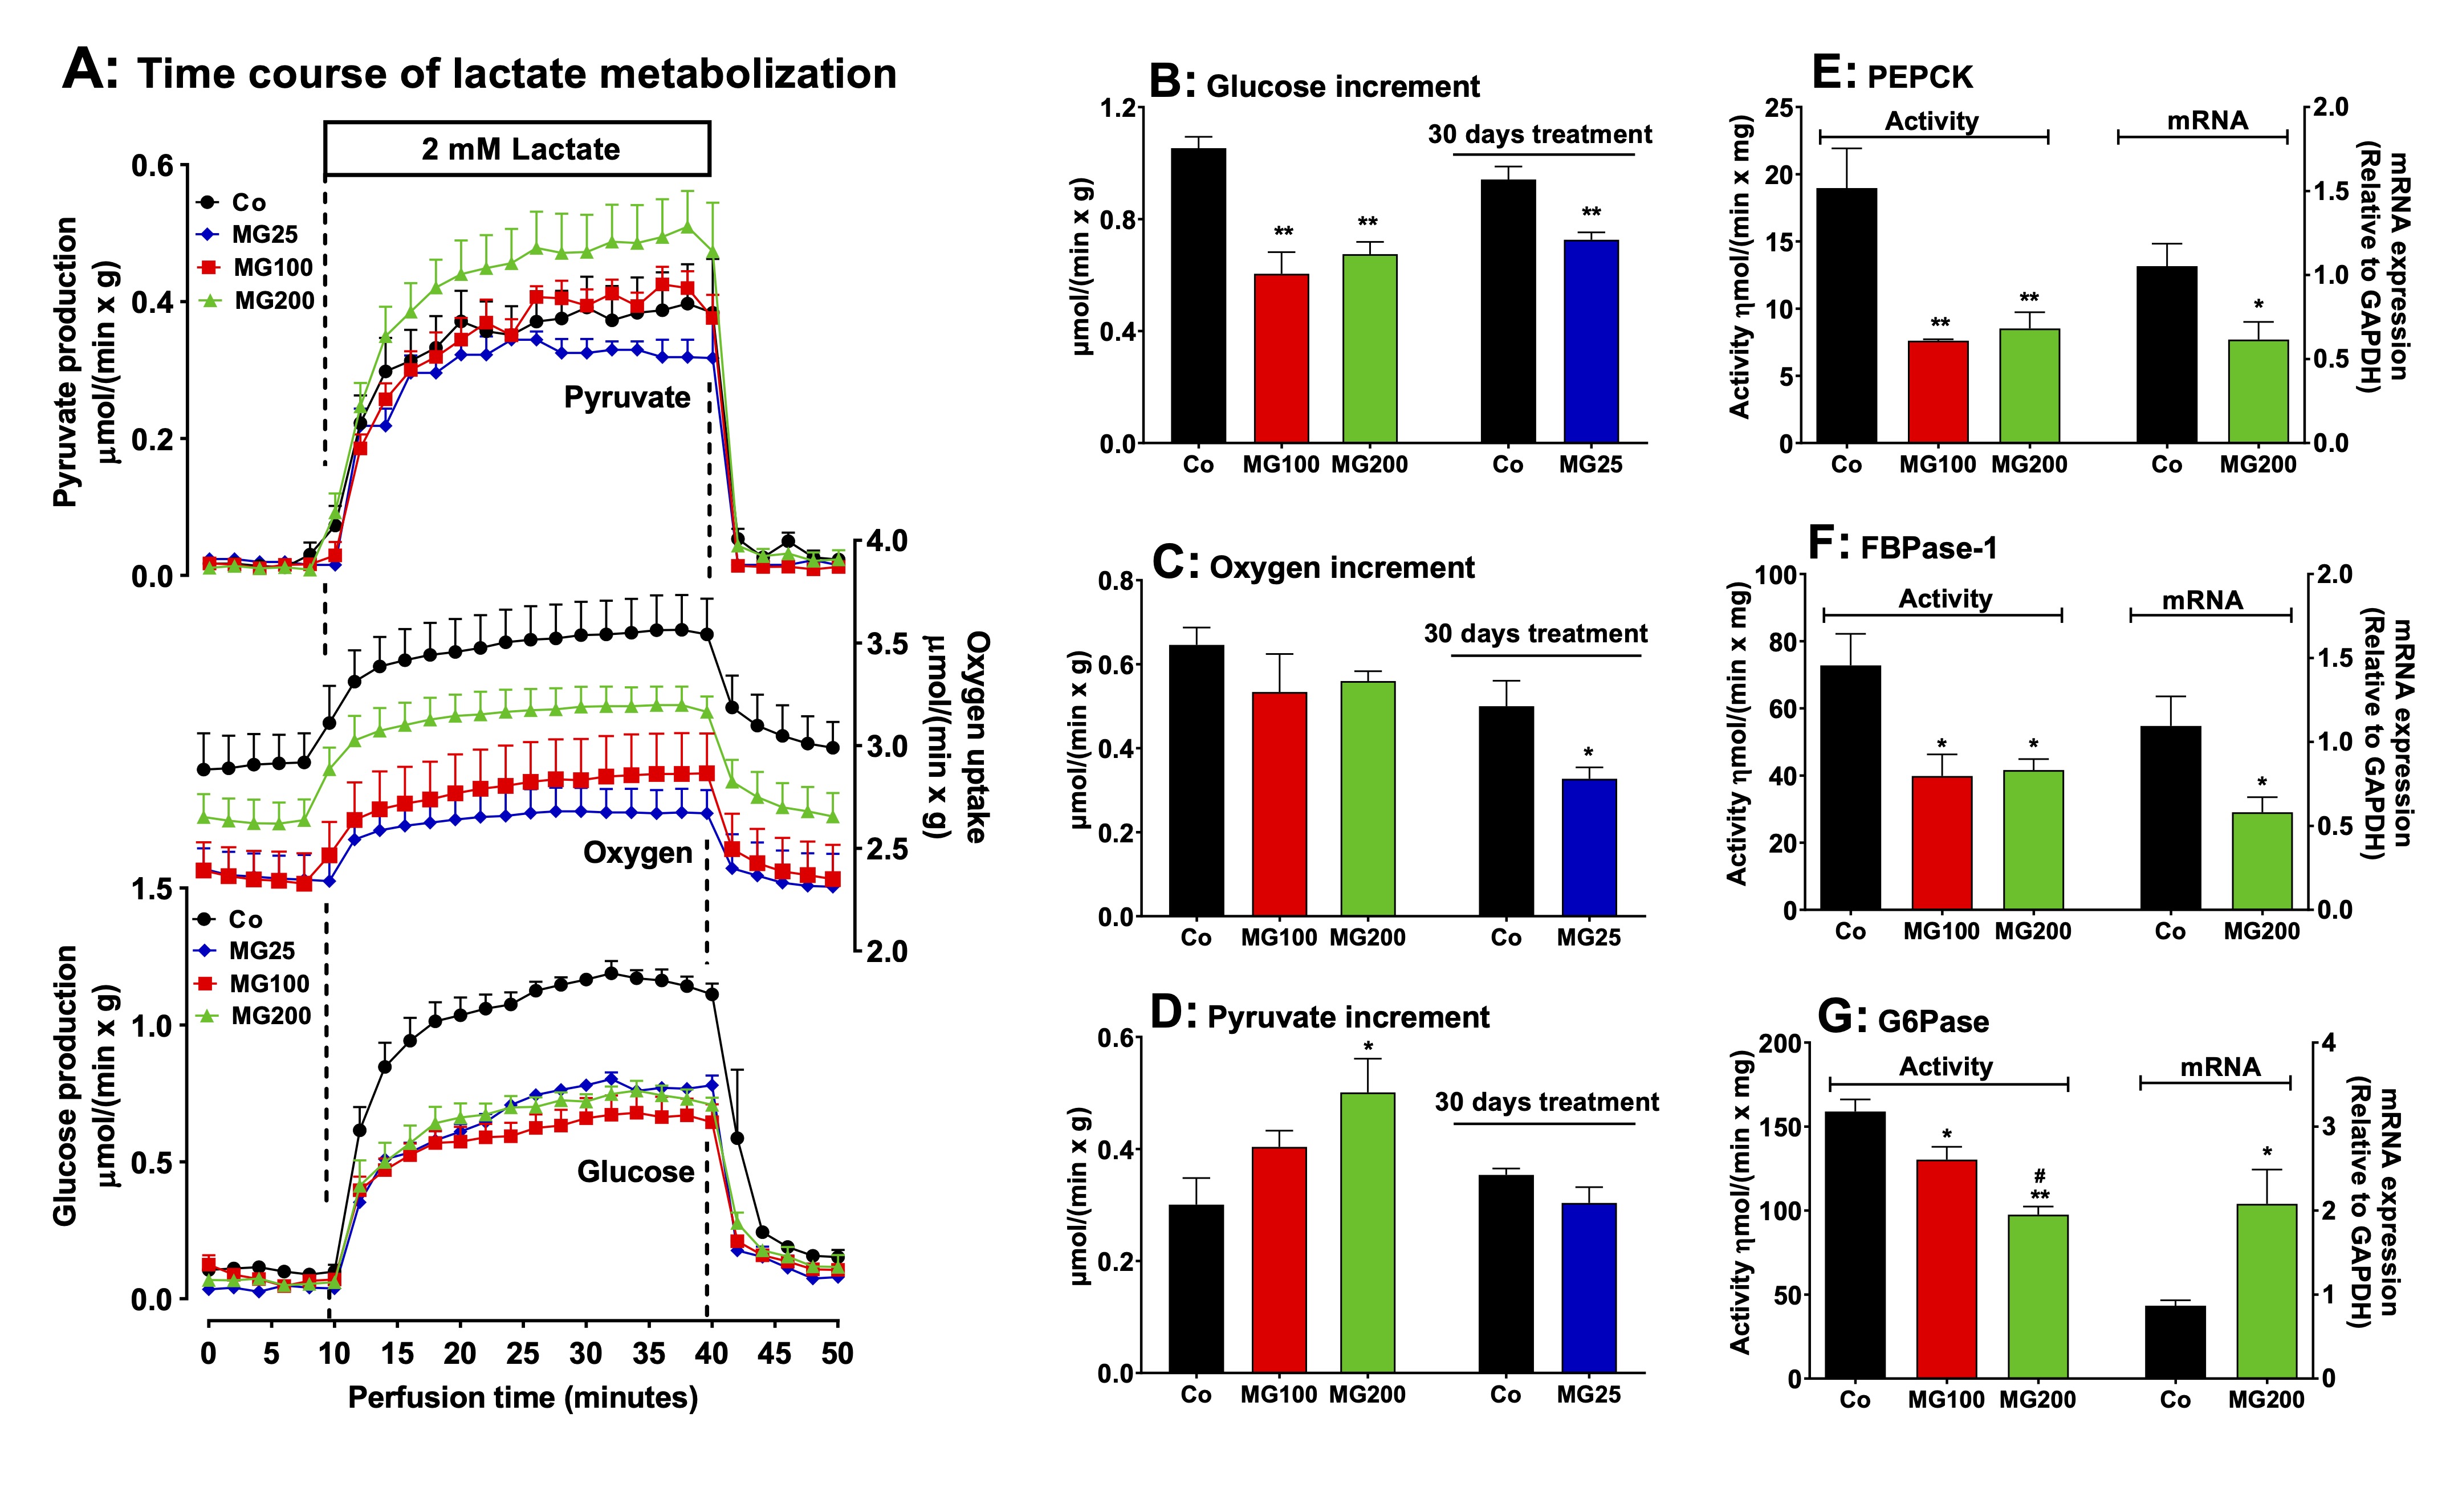
Fig. 3: Effects of MG on hepatic gluconeogenesis from lactate and activities and mRNA expressions of key gluconeogenic enzymes. Panel A: time courses of glucose and pyruvate production and oxygen consumption due to lactate infusion. The animals received i.p. saline (Co), 100 or 200 mg/kg MG (MG100 and MG200) for 7 days or 25 mg/kg MG (MG25) for one month. Livers from 12 h fasted rats were perfused with Krebs/Henseleit-bicarbonate buffer in combination with 2 mM L-lactate as indicated by the horizontal box in Panel A. The outflowing perfusate was sampled at regular intervals and analyzed for its contents of glucose, lactate and pyruvate. Oxygen uptake was monitored by polarography. The values in Panels B, C and D are the increments of metabolites production due to lactate infusion. They were calculated from the data in Fig. 3A as [final values at the end of the infusion period with L-lactate; 28 min] - [basal rates before infusion of L-lactate; 8 min]. Panels E, F and G show the effects of MG on the hepatic activities and mRNA expressions of the gluconeogenic enzymes phosphoenolpyruvate carboxykinase (PEPCK), fructose 1,6-bisphosphatase 1 (FBPase-1) and glucose 6-phosphatase (G6Pase). The activities are referred to the corresponding protein content (mg) and the mRNA expressions are given in arbitrary units (AU). Data are the mean ± SEM of 4-7 animals. *p<0.05 and **p<0.0001: different from Co; #p<0.05 and ##p<0.0001: difference between MG100 and MG200.
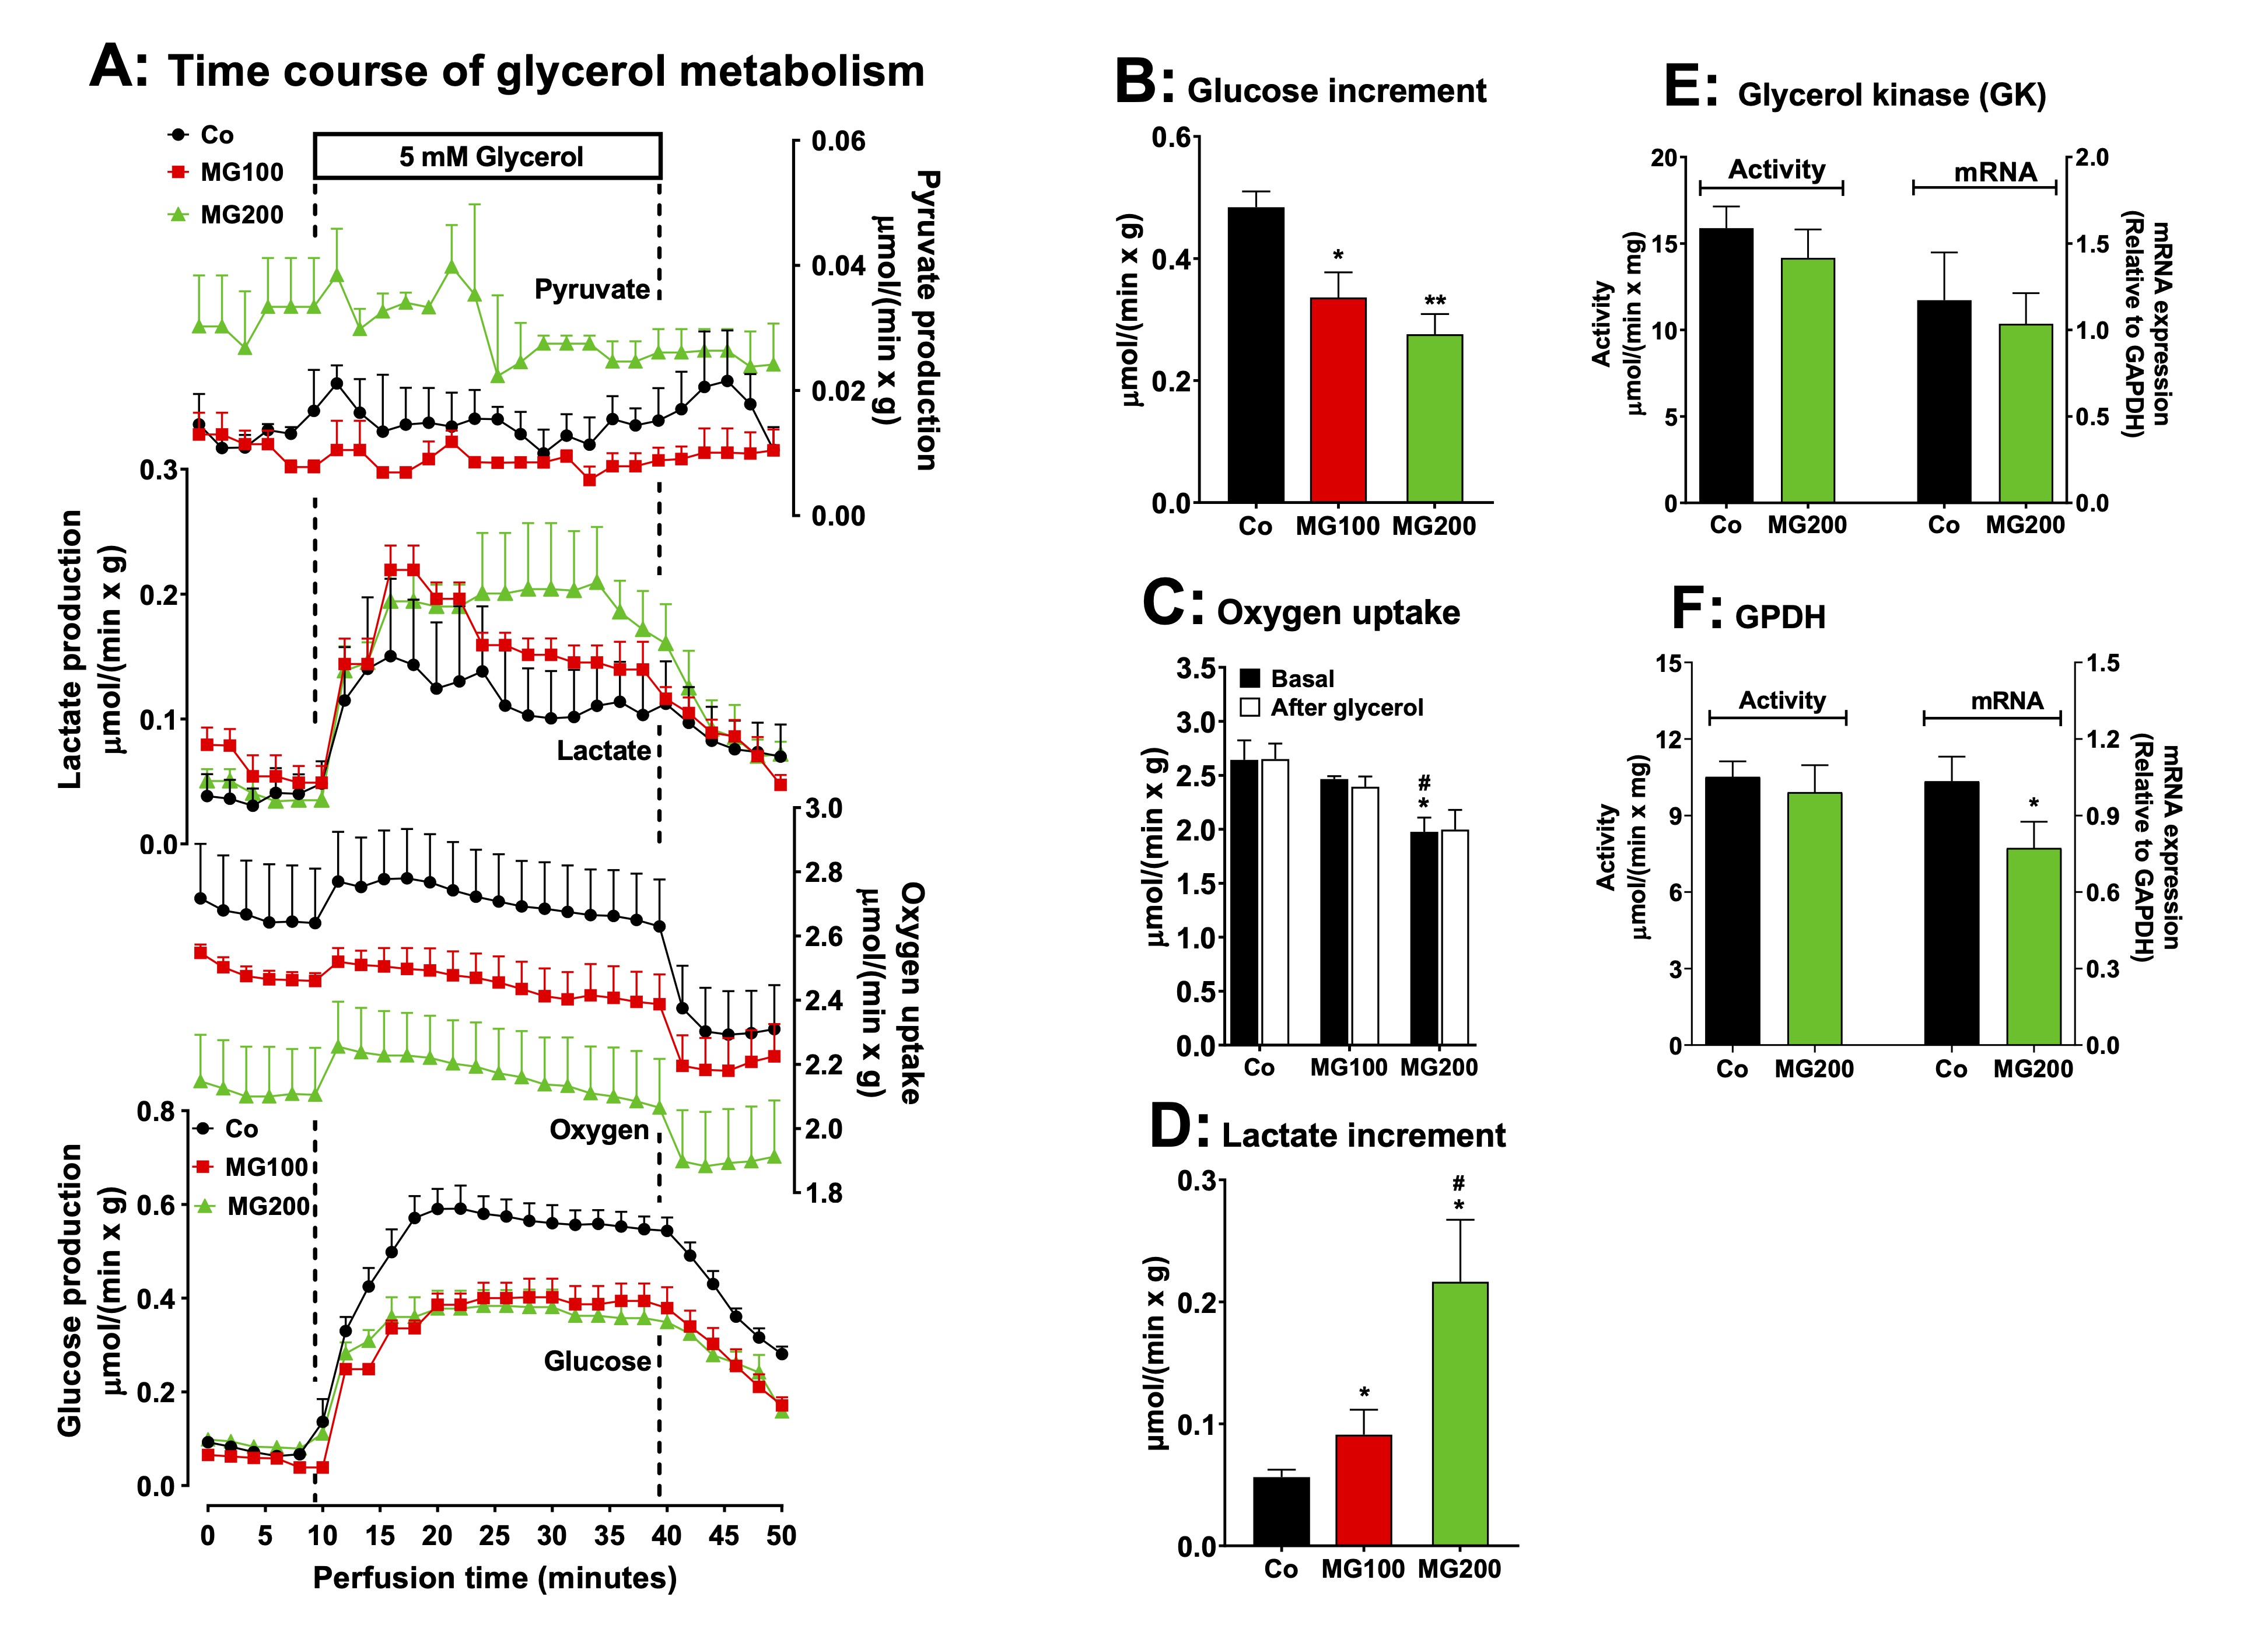
Fig. 4: Effects of MG on glycerol metabolism in perfused liver. Panel A: time courses of glucose, lactate and pyruvate production and oxygen consumption due to glycerol infusion. The animals received i.p. saline (Co), 100 or 200 mg/kg MG (MG100 and MG200) for 7 days. Livers from 12 h fasted rats were perfused with Krebs/Henseleit-bicarbonate buffer in combination with 5 mM D-glycerol as indicated by the horizontal box in Panel A. The outflowing perfusate was sampled in regular intervals and analyzed for its contents of glucose, lactate and pyruvate. Oxygen uptake was monitored by polarography. The values in Panels B and D are the increment of metabolites productions due to glycerol infusion. They were calculated from the data in Fig. 4A as [final values at the end of the infusion period with D-glycerol; 36 min] - [basal rates before infusion of D-glycerol; 8 min]. Panel C shows the oxygen consumption at the steady state in the basal period and after the infusion of glycerol. Panels E and F reveal the effects of MG on the hepatic activities and mRNA expressions of the specific enzymes involved in the gluconeogenesis from glycerol: glycerol kinase (GK) (panel E) and glycerol-3-phosphate dehydrogenase (GPDH) (panel F). The mRNA expressions are given in arbitrary units (AU). Data are the mean ± SEM of 4-7 animals. *p<0.05 and **p<0.0001: different from Co; #p<0.05: difference between MG100 and MG200.
MG modifies respiratory functions of isolated hepatic mitochondria
The
lactate accumulation caused by MG in the glycerol-perfused liver may
be associated with the low efficiency of pyruvate transport into
mitochondria within a short period. However, it may also result from
mitochondrial alteration. In addition, MG not only reduced
gluconeogenesis but also decreased hepatic oxygen consumption.
Therefore, the respiratory activity and mitochondrial membrane
potential (MMP) were evaluated in isolated liver mitochondria.
The
results are shown in Fig. 5. Basal respiration (before ADP addition),
driven by succinate, but not by α-ketoglutarate,
was stimulated by approximately 25% in
mitochondria of animals that received MG, when compared to the
controls (Fig. 5A). State III respiration, also driven only by
succinate,
was stimulated by 35% in
mitochondria of the group that received 200 mg/kg MG (Fig. 5B). State
IV was
stimulated in mitochondria of both groups that received MG by 47% and
37% when the respiration was driven, respectively, by succinate and
α-ketoglutarate
(Fig. 5C). In consequence, the RC was reduced in mitochondria of both
groups that received MG
by 22% and 24% with succinate and α-ketoglutarate, respectively
(Fig. 5D). The ADP/O ratio, however, was not modified in animals
which received both doses of MG (Fig. 5E). The activities of
succinate and NADH oxidases were also not affected by the treatment
with MG (Fig. 5F). The MMP was approximately 50% lower in
mitochondria from animals that received MG when compared to the
controls (Fig. 5E). Taken together, these results indicate that MG
induces mild uncoupling and likely affects gluconeogenesis to a
lesser extent than the inhibition of rate-limiting enzymes.
Similarly, this phenomenon is unlikely to be the cause of lactate
accumulation.
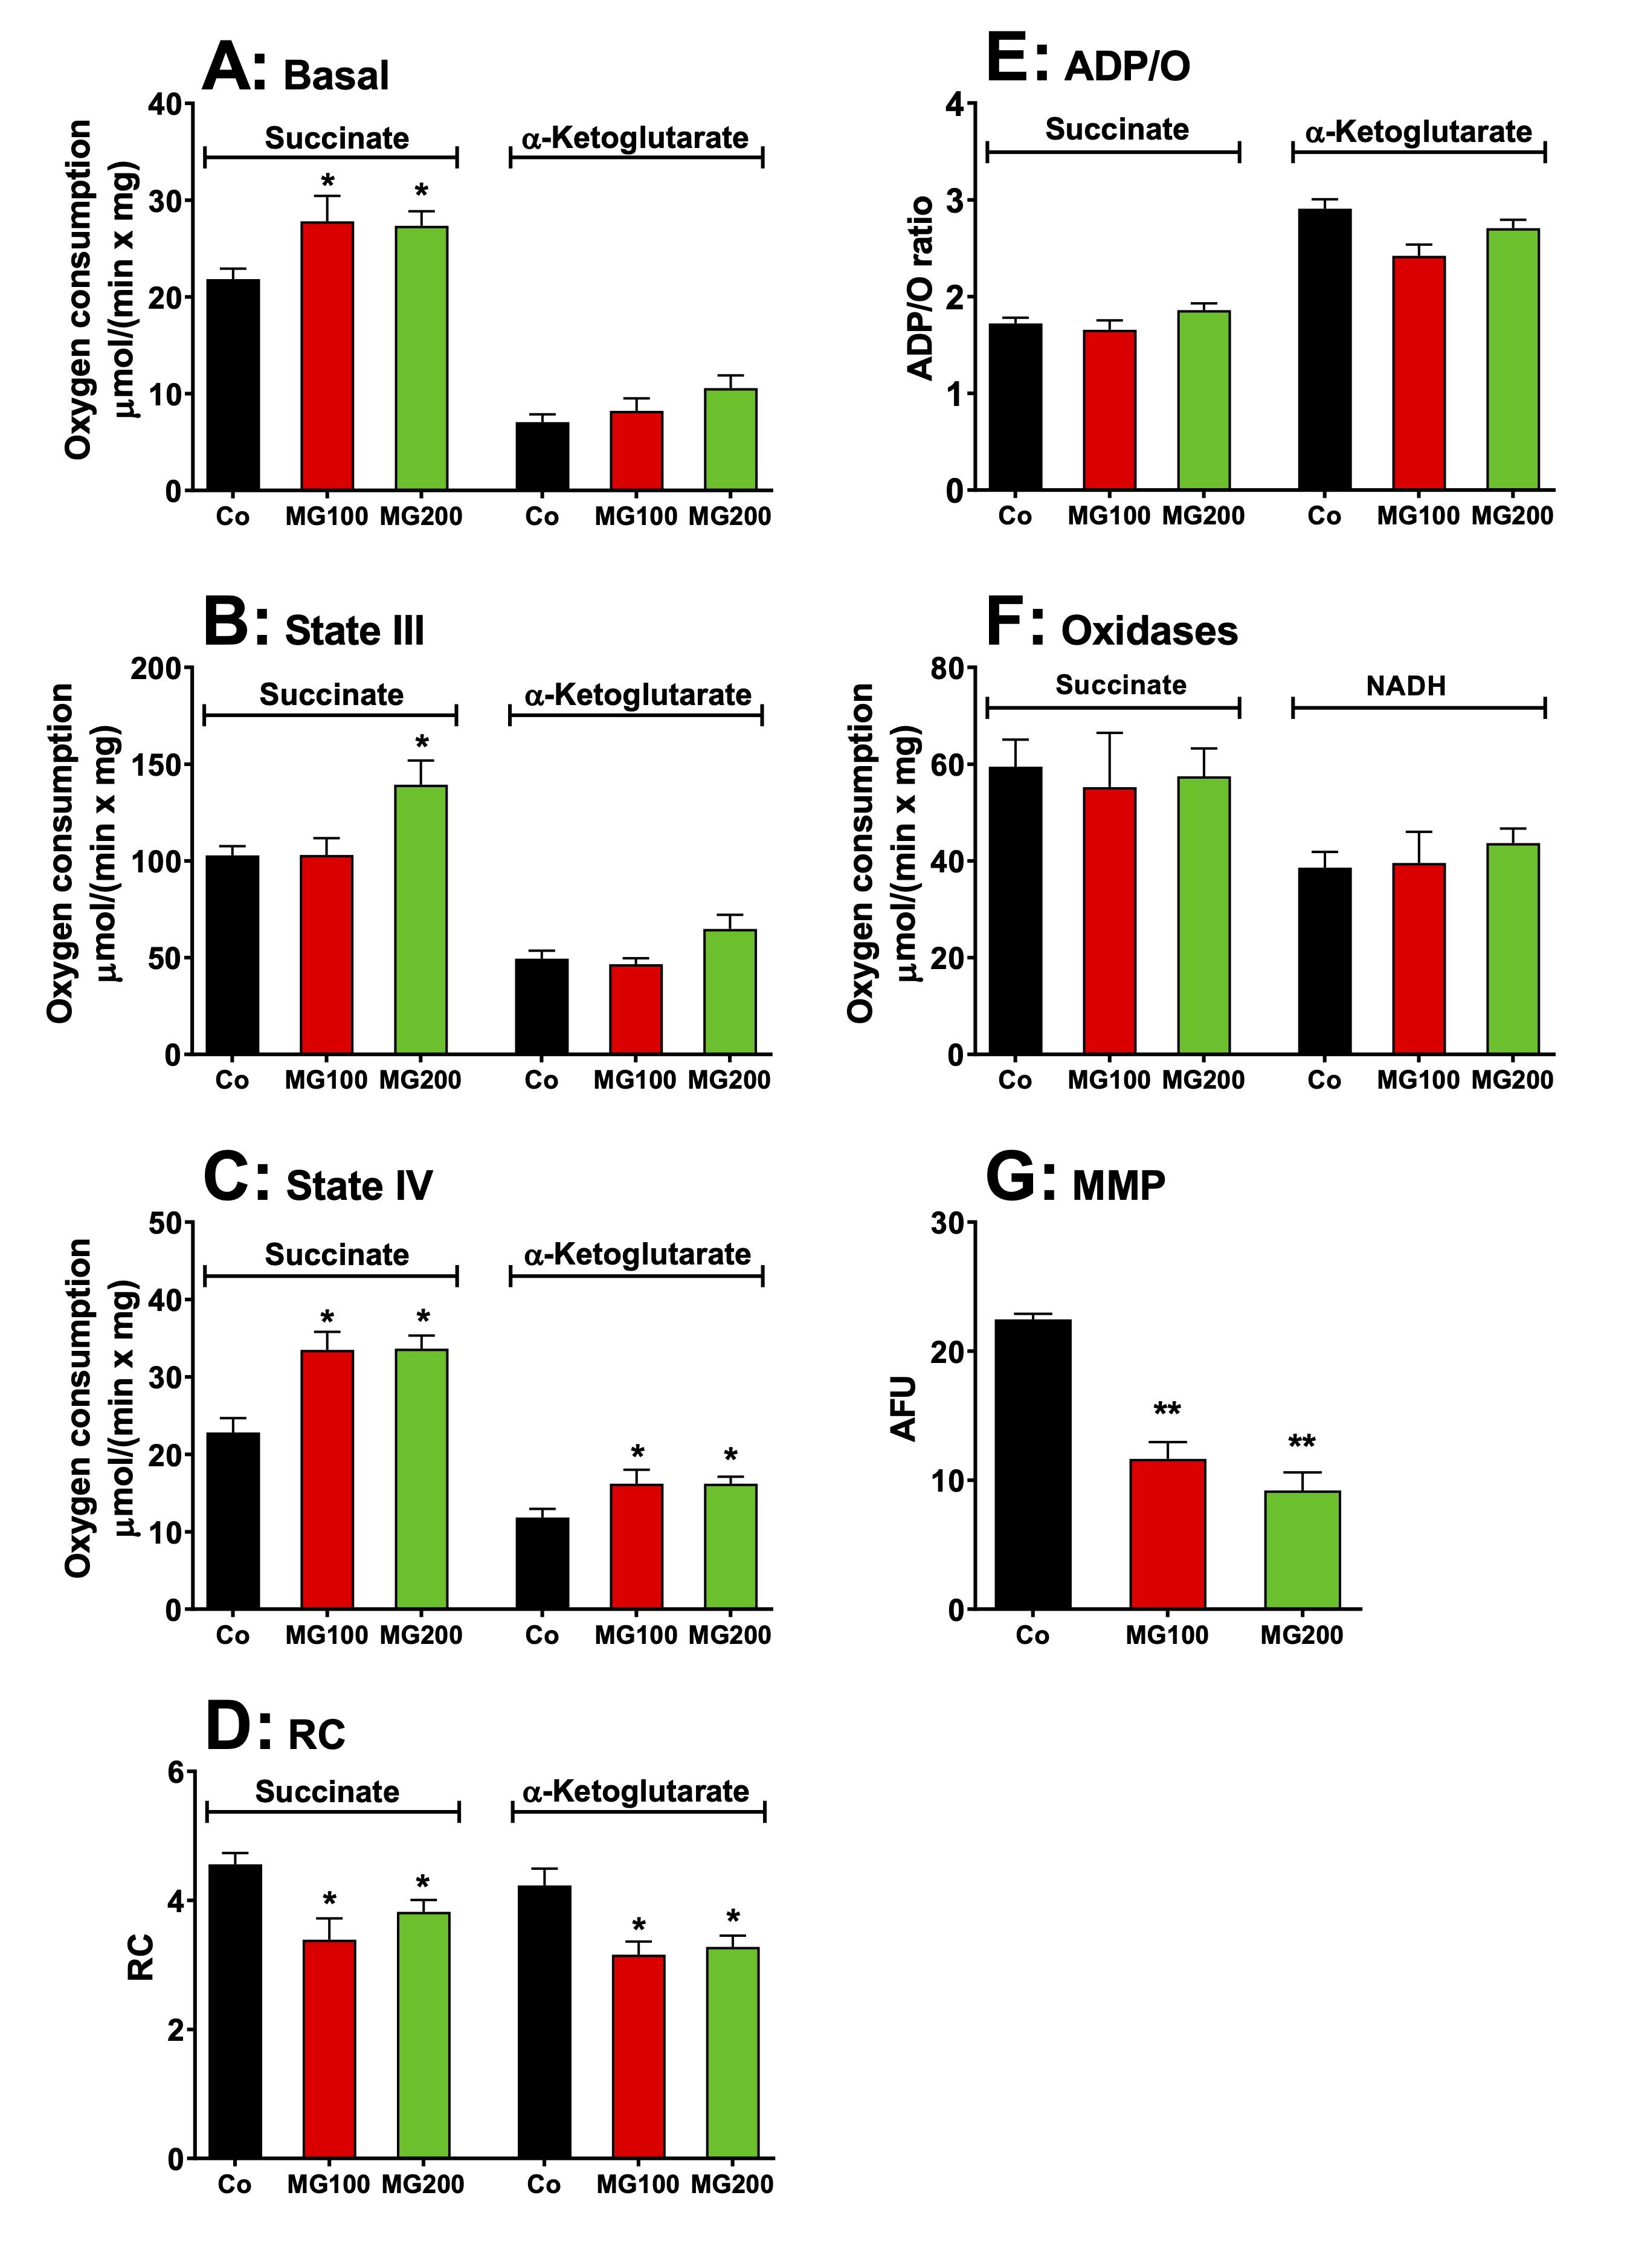
Fig. 5: Effects of MG on respiratory activity and membrane potential of intact isolated hepatic mitochondria of rats. Hepatic mitochondria were isolated from animals which received i.p. saline (Co), 100 or 200 mg/kg MG (MG100 and MG200) for 7 days. For measuring the respiratory activity, intact mitochondria (1.0 mg·mL-1) were incubated at 37 ºC in a closed oxygraph chamber containing 2 mL reaction medium. The respiratory substrates were 10 mM succinate or α-ketoglutarate. The respiration rates were measured under three conditions: (A) before the addition of ADP (basal respiration), (B) just after 0.125 mM ADP addition (state III respiration) and (C) after cessation of the ADP stimulation (state IV). The respiratory control (RC) was the ratio of state III/state IV (D) and the ADP/O ratio is defined as the number of moles of ADP phosphorylated per atom-gram of O2 consumption (E). The activities of succinate oxidase and NADH oxidase (F) were measured in freeze-thawing disrupted mitochondria using, respectively, succinate and NADH as substrates. The mitochondrial membrane potential (MMP) (G) was measured by spectrofluorimetry using the dye safranin and the results are expressed as arbitrary fluorescence units (AFU). Data are the mean ± SEM of 4-7 animals. *p<0.05 and **p<0.0001: different from Co.
MG decreases glycogen catabolism in the liver
The
production of lactate from glycerol was increased in perfused livers
of rats which
received MG. This indicates an increased flux of carbon units derived
from this substrate through glycolysis. This raises the question if
MG also modifies the flux of carbon units derived from endogenous
glycogen. Livers from fed rats, when perfused with substrate-free
medium, survive at the expense of glycogen degradation via glycolysis
and oxidation of endogenous fatty acids [38, 51]. Under these
conditions the liver releases glucose, lactate and pyruvate as a
result of glycogen catabolism. Fig. 6A illustrates the time-courses
of metabolic modifications in the perfused livers of the controls and
rats that received MG. Four parameters were measured: glucose
release, lactate and pyruvate productions and oxygen consumption.
Most parameters presented fluctuations along the perfusion time.
Glucose release, in particular, presented a tendency of declining.
This tendency was strongest in the case of the livers from the group
that received 200 mg/kg MG. The general tendency, however, was one of
stabilization during the last 10 minutes of perfusion. For this
reason, the data shown in panels B to G represent the mean values of
each variable in the period between 25 and 30 min perfusion time.
During this period of time, glucose release from livers of the group
that received 200 mg/kg MG was approximately 50% lower than that one
of livers from the controls (Fig. 6B). Glucose release from livers of
the group that received 100 mg/kg MG was not different of that of
livers from the controls. The same pattern was observed with lactate
production (Fig. 6D), except that the decrease in the group that
received 200 mg/kg MG reached 60%. The fluctuations in oxygen uptake
(Fig. 6C) and pyruvate production (Fig. 6E) were not statistically
significant. The changes in glycogenolysis and glycolysis, shown in
panels F and G, show the same patterns as the changes in lactate
production and glucose release.
The
lactate/pyruvate ratios, an indicative of the cytosolic NADH/NAD+
ratio in the liver [20], were
not different for all groups (results not shown). These results
suggest that MG decreases glycogen storage, consistent with the
catabolic state revealed by the previous experiments.
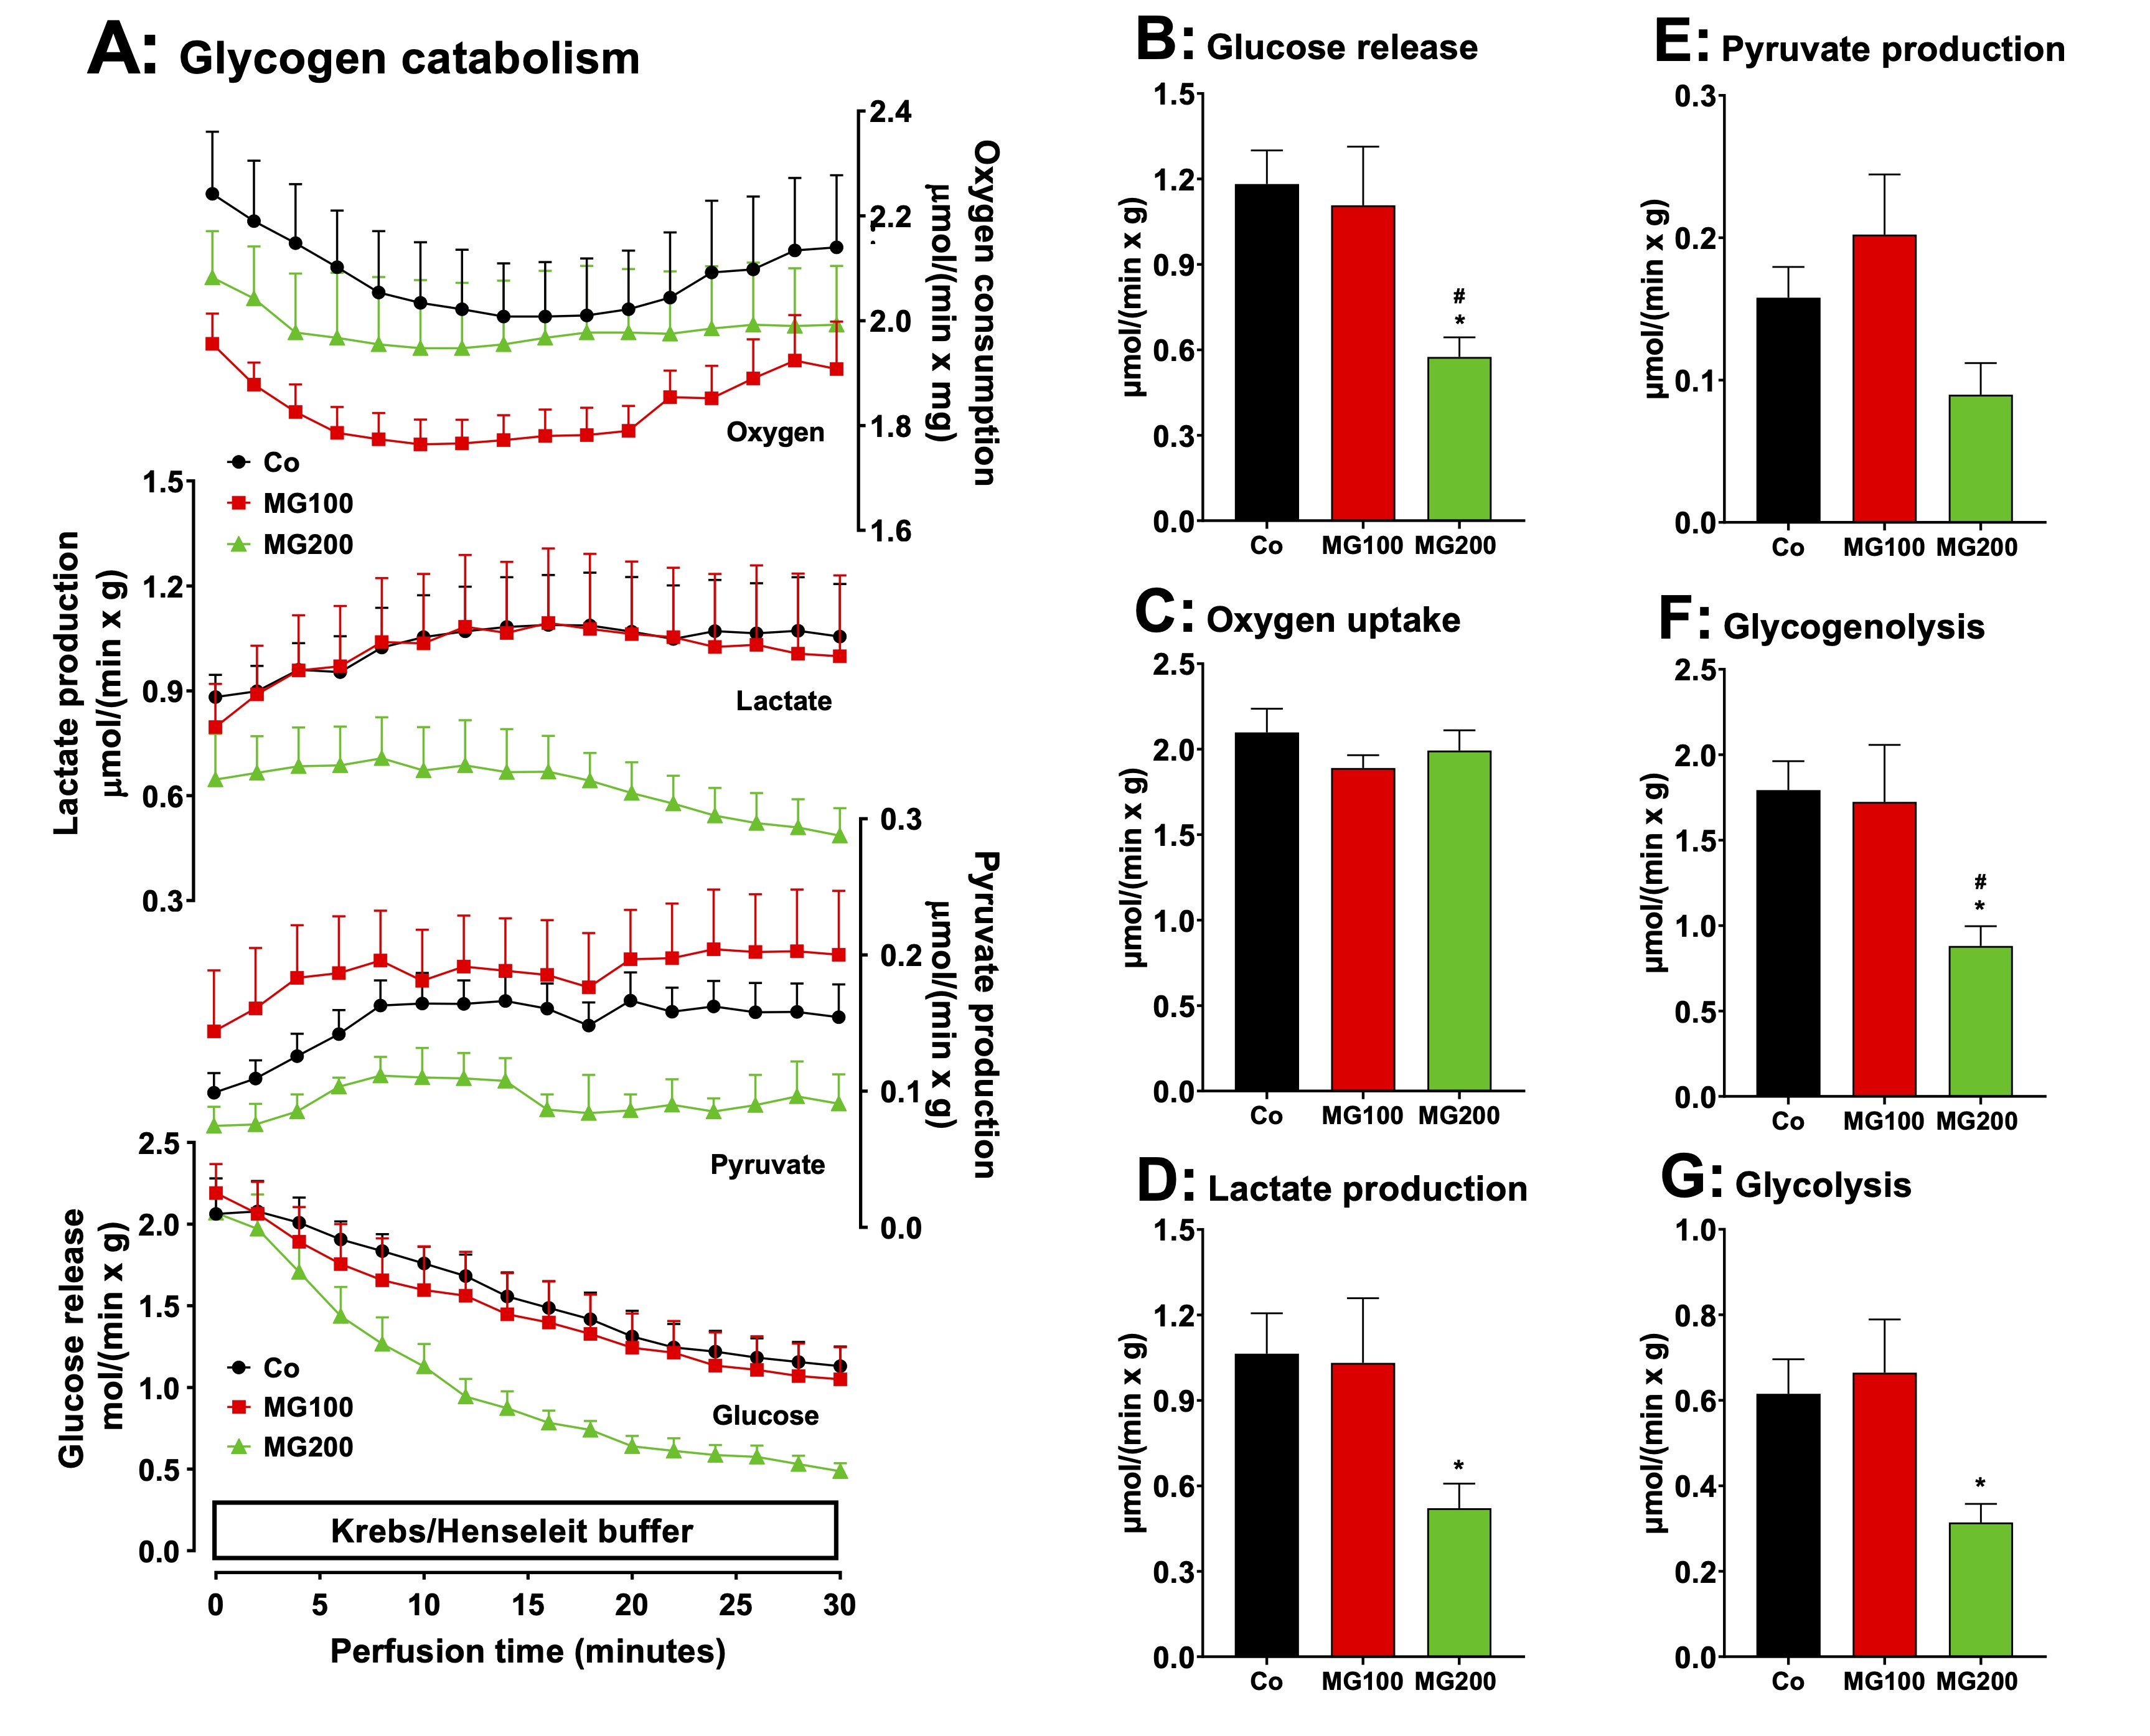
Fig. 6: Effects of MG on glycogen catabolism in perfused livers of fed rats. Panel A: time courses of glucose, lactate and pyruvate production and oxygen consumption. The animals received i.p. saline (Co), 100 or 200 mg/kg MG (MG100 and MG200) for 7 days. Livers from fed rats were perfused with substrate-free Krebs/Henseleit bicarbonate buffer. The outflowing perfusate was sampled in regular intervals and analyzed for its contents of glucose, lactate and pyruvate. Oxygen uptake was monitored by polarography. Data are the mean ± SEM obtained from 5 animals for each condition. The values in Panels B, C, D and E are, respectively, the rates of glucose release, oxygen consumption, and lactate and pyruvate production observed after stabilization of the corresponding curves (26 min perfusion time). The values in Panels F and G were calculated from the rates of glucose, lactate and pyruvate production at 26 min perfusion time in Panel A. Glycogenolysis = glucose + 1/2(lactate + pyruvate) and glycolysis = 1/2(lactate + pyruvate). Each datum point represents the mean of 5 liver perfusion experiments. *p<0.05: different from Co; #p<0.05: difference between MG100 and MG200.
MG modifies glucose and lipid homeostasis
As MG
altered adipose tissue weight and caused a substantial modification
in hepatic carbohydrate metabolism, the next steps were to
investigate whether this compound modifies systemic glucose and lipid
homeostasis. Fig. 7 shows the results. Compared to the control group,
fasting glycemia was 22% lower in the groups that received 100 and
200 mg/kg MG (Fig 7A; OGTT, time zero). The slopes of the initial
increments in blood glucose were similar for all groups, but the
initial level in the control condition (Co) was higher, the reason,
possibly, why the peak value of the latter (30 min) was also higher.
Return to the basal glycemia, however, occurred in the controls
during the next 30 min, whereas no such return was observed for the
animals that received MG. This may be indicating lower rates of
glucose transformation. In the ITT (Fig. 7B), the response of the
control was more pronounced, as indicated by the kITT
values that were 40% lower in the groups that received 100 and 200
mg/kg MG (insert in Fig. 7B), although the starting points were
different, suggesting that MG causes insulin resistance. Plasma
and hepatic lipid profiles are shown in Figs. 7C and 7D. Compared to
the controls, the levels of TAG were 28% lower in the plasma from
rats that received 200 mg/kg MG (Fig. 7C). The total plasma
cholesterol levels were not modified by MG, but HDL cholesterol was
diminished. In the liver the content of total lipids was not affected
by the MG treatment, but the TAG content was reduced by 35%,
irrespective of the dose (Fig. 7D). The hepatic total cholesterol
level, on the other hand, was 40% higher in the group that received
200 mg/kg MG. The liver weight was not
modified by the MG treatment (Fig. 7E). The plasma levels of
glycerol were 33% and 74% higher, respectively, in the groups that
received 100 and 200 mg/kg MG, suggesting a higher lipolytic activity
in the adipose tissue (Fig. 7E). The plasma levels of total ketone
bodies, β-hydroxybutyrate and acetoacetate
were, respectively, 44%, 43% and 68% lower in the group that received
200 mg/kg MG, but not modified in the group that received 100 mg/kg
MG (Fig. 7F).
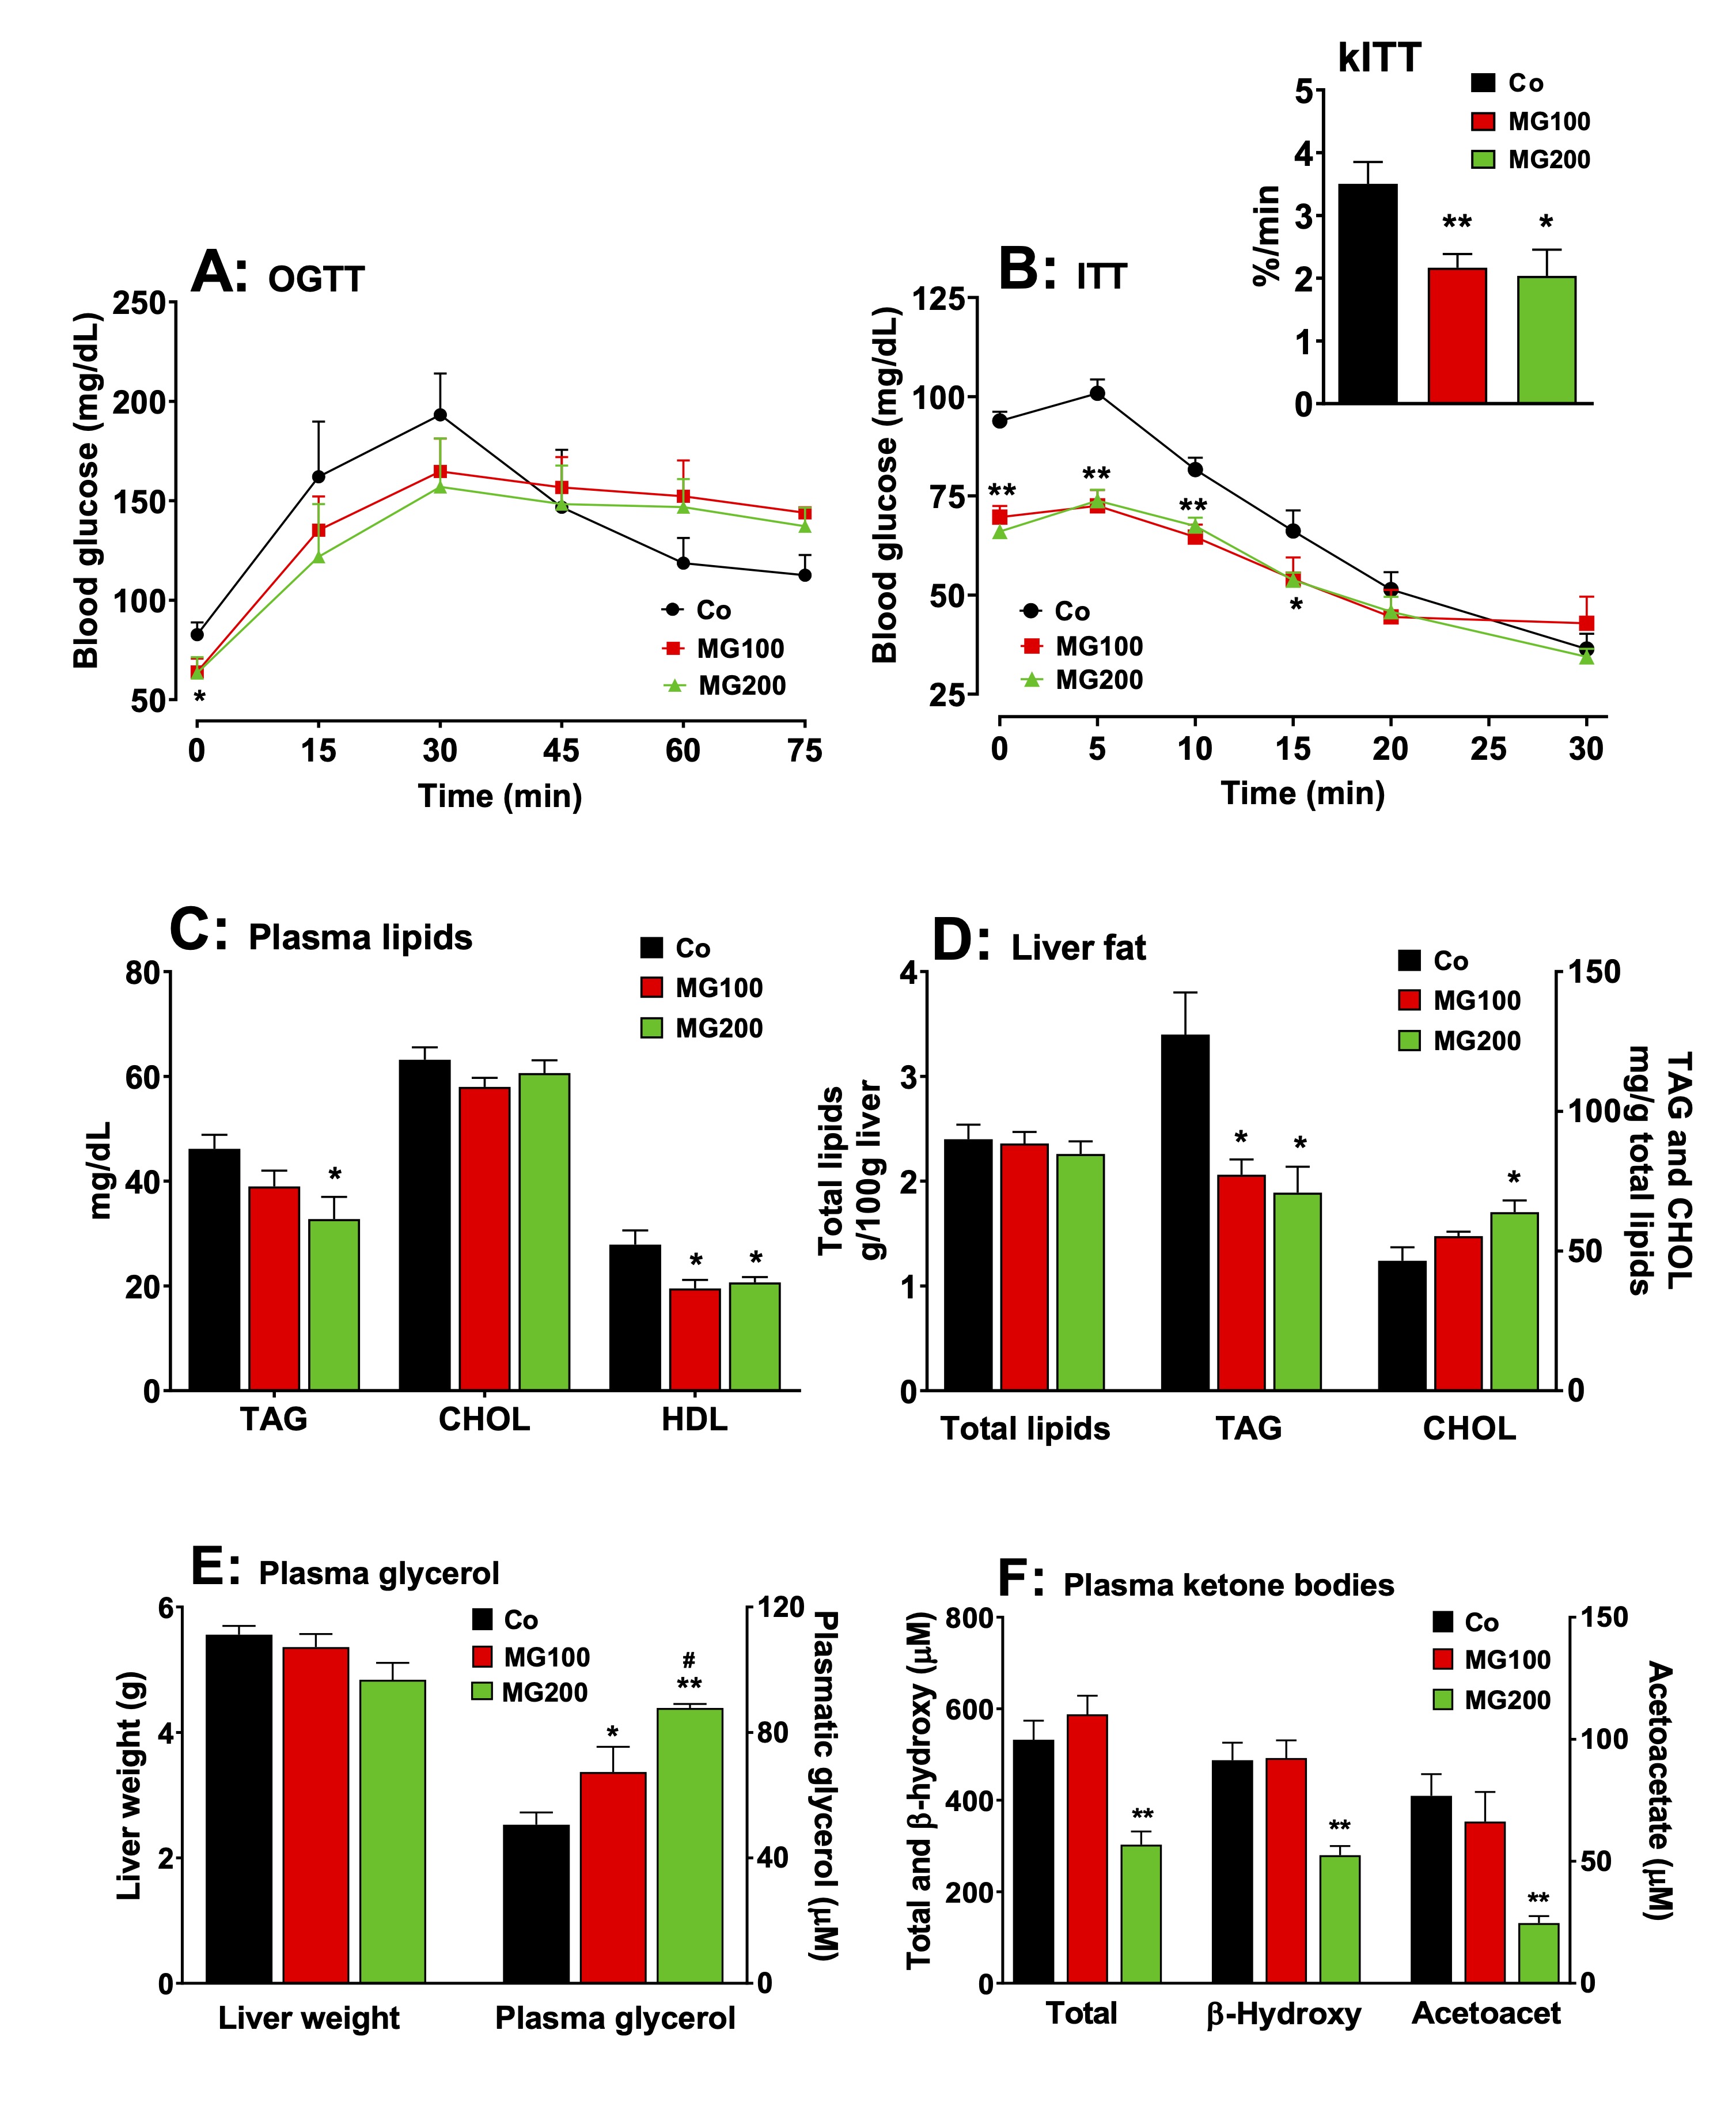
Fig. 7: Effects of MG on glucose and lipid homeostasis. A: fasting glycemia and oral glucose tolerance test (OGTT). B: insulin tolerance test and the rate constant for insulin tolerance test (kITT). C and D: Plasma and hepatic lipid profile, respectively. E: Liver weight and plasma glycerol. F: Plasma ketone bodies profile. The animals received i.p. saline (Co), 100 or 200 mg/kg MG (MG100 and MG200) for 7 days. OGTT was performed by oral administration of glucose (1.5 g/kg) to 12 h fasted rats. At indicated times, blood samples were taken from each animal by tail incision and glucose was measured using a glucometer. Fasting glycemia was measured immediately before glucose administration (at time zero in Panel A). ITT was performed by injecting regular insulin (1 U/kg body mass) i.p. into 12-h fasted rats with subsequent blood glucose measurement at the times indicated in panel B. kITT (inset in Panel B) was calculated as the slope of the linear segment of each curve (from time 5 to 20 in Panel C). The plasma levels of triglycerides (TAG), total cholesterol (CHOL), HDL cholesterol, glycerol, β-hydroxybutyrate (β-hydroxy) and acetoacetate (acetoacet) and the hepatic contents of total lipids, TAG and CHOL were assessed in 12 h fasted rats. Values are the mean ± SEM of 5-8 animals. *p<0.05 and **p<0.001: different from Co. #p<0.05: difference between MG100 and MG200.
MG increases hepatic ketogenesis from fatty acids
The
administration of MG modified lipolysis in adipose tissue and the
levels of plasma ketone bodies. The latter are produced in the liver
and measuring their production may be helpful in clarifying the
action of MG. In the present study ketogenesis was measured in the
perfused liver before and during palmitic acid infusion. Fig.
8A shows
the time courses of β-hydroxybutyrate and acetoacetate productions
and of oxygen uptake in perfused livers of fasted rats. There are
differences in the basal rates among the various groups, but also
differences in the stimulations caused by palmitate. To facilitate
comparisons, Figs. 8B-I present, for all parameters, the basal rates
(8 min perfusion time in Fig. 8A), the rates during palmitic acid
infusion (28 min in Fig. 8A) and the absolute increments (Δ) caused
by palmitic acid infusion (values at 28 min – values at 8 min). The
onset of palmitic acid caused a stimulus in oxygen uptake (~12%) in
the livers of all groups (Figs. 8B and 8C). In the group that
received 200 mg/kg MG the absolute increment in oxygen uptake was the
highest (Fig. 8C). The basal rates of β-hydroxybutyrate production
were not different among all groups and the onset of palmitic acid
stimulated this parameter in the liver by 100%
in the controls and rats that received 100 mg/kg MG and 170% in the
rats that received 200 mg/kg MG (Fig. 8D). Here again, the absolute
increment was the highest in the in the group that received 200 mg/kg
MG (Fig. 8E). The basal rates of acetoacetate production were 37% and
57% lower in the livers from rats which received 100 and 200 mg/kg MG
(compared to controls), respectively, and palmitic acid increased all
in similar proportions (~30%) (Fig. 8F). Fig. 8G shows the
β-hydroxybutyrate/acetoacetate ratios in the livers in the absence
and presence of palmitic acid. The basal ratios were not
statistically different in all groups before the infusion of palmitic
acid, but upon infusion of the latter they were increased by 75% and
95% in the groups that received 100 and 200 mg/kg MG, respectively
(Fig. 8G). No such increase was found when palmitic acid was infused
in livers from the controls. Compared to the controls, the total
ketone bodies production in the absence of palmitic acid was 37% and
43% lower in the livers from rats that received 100 and 200 mg/kg MG,
respectively (Fig. 8H). Palmitic acid infusion increased the total
ketone bodies production by 29%, 62% and 87%, respectively, in the
controls, group that received 100 mg/kg MG and group that received
200 mg/kg MG (Fig. 8H). In absolute terms, the increment in total
ketone bodies production caused by palmitic acid was highest in
livers of rats that received 200 mg/kg MG (Fig. 8I).
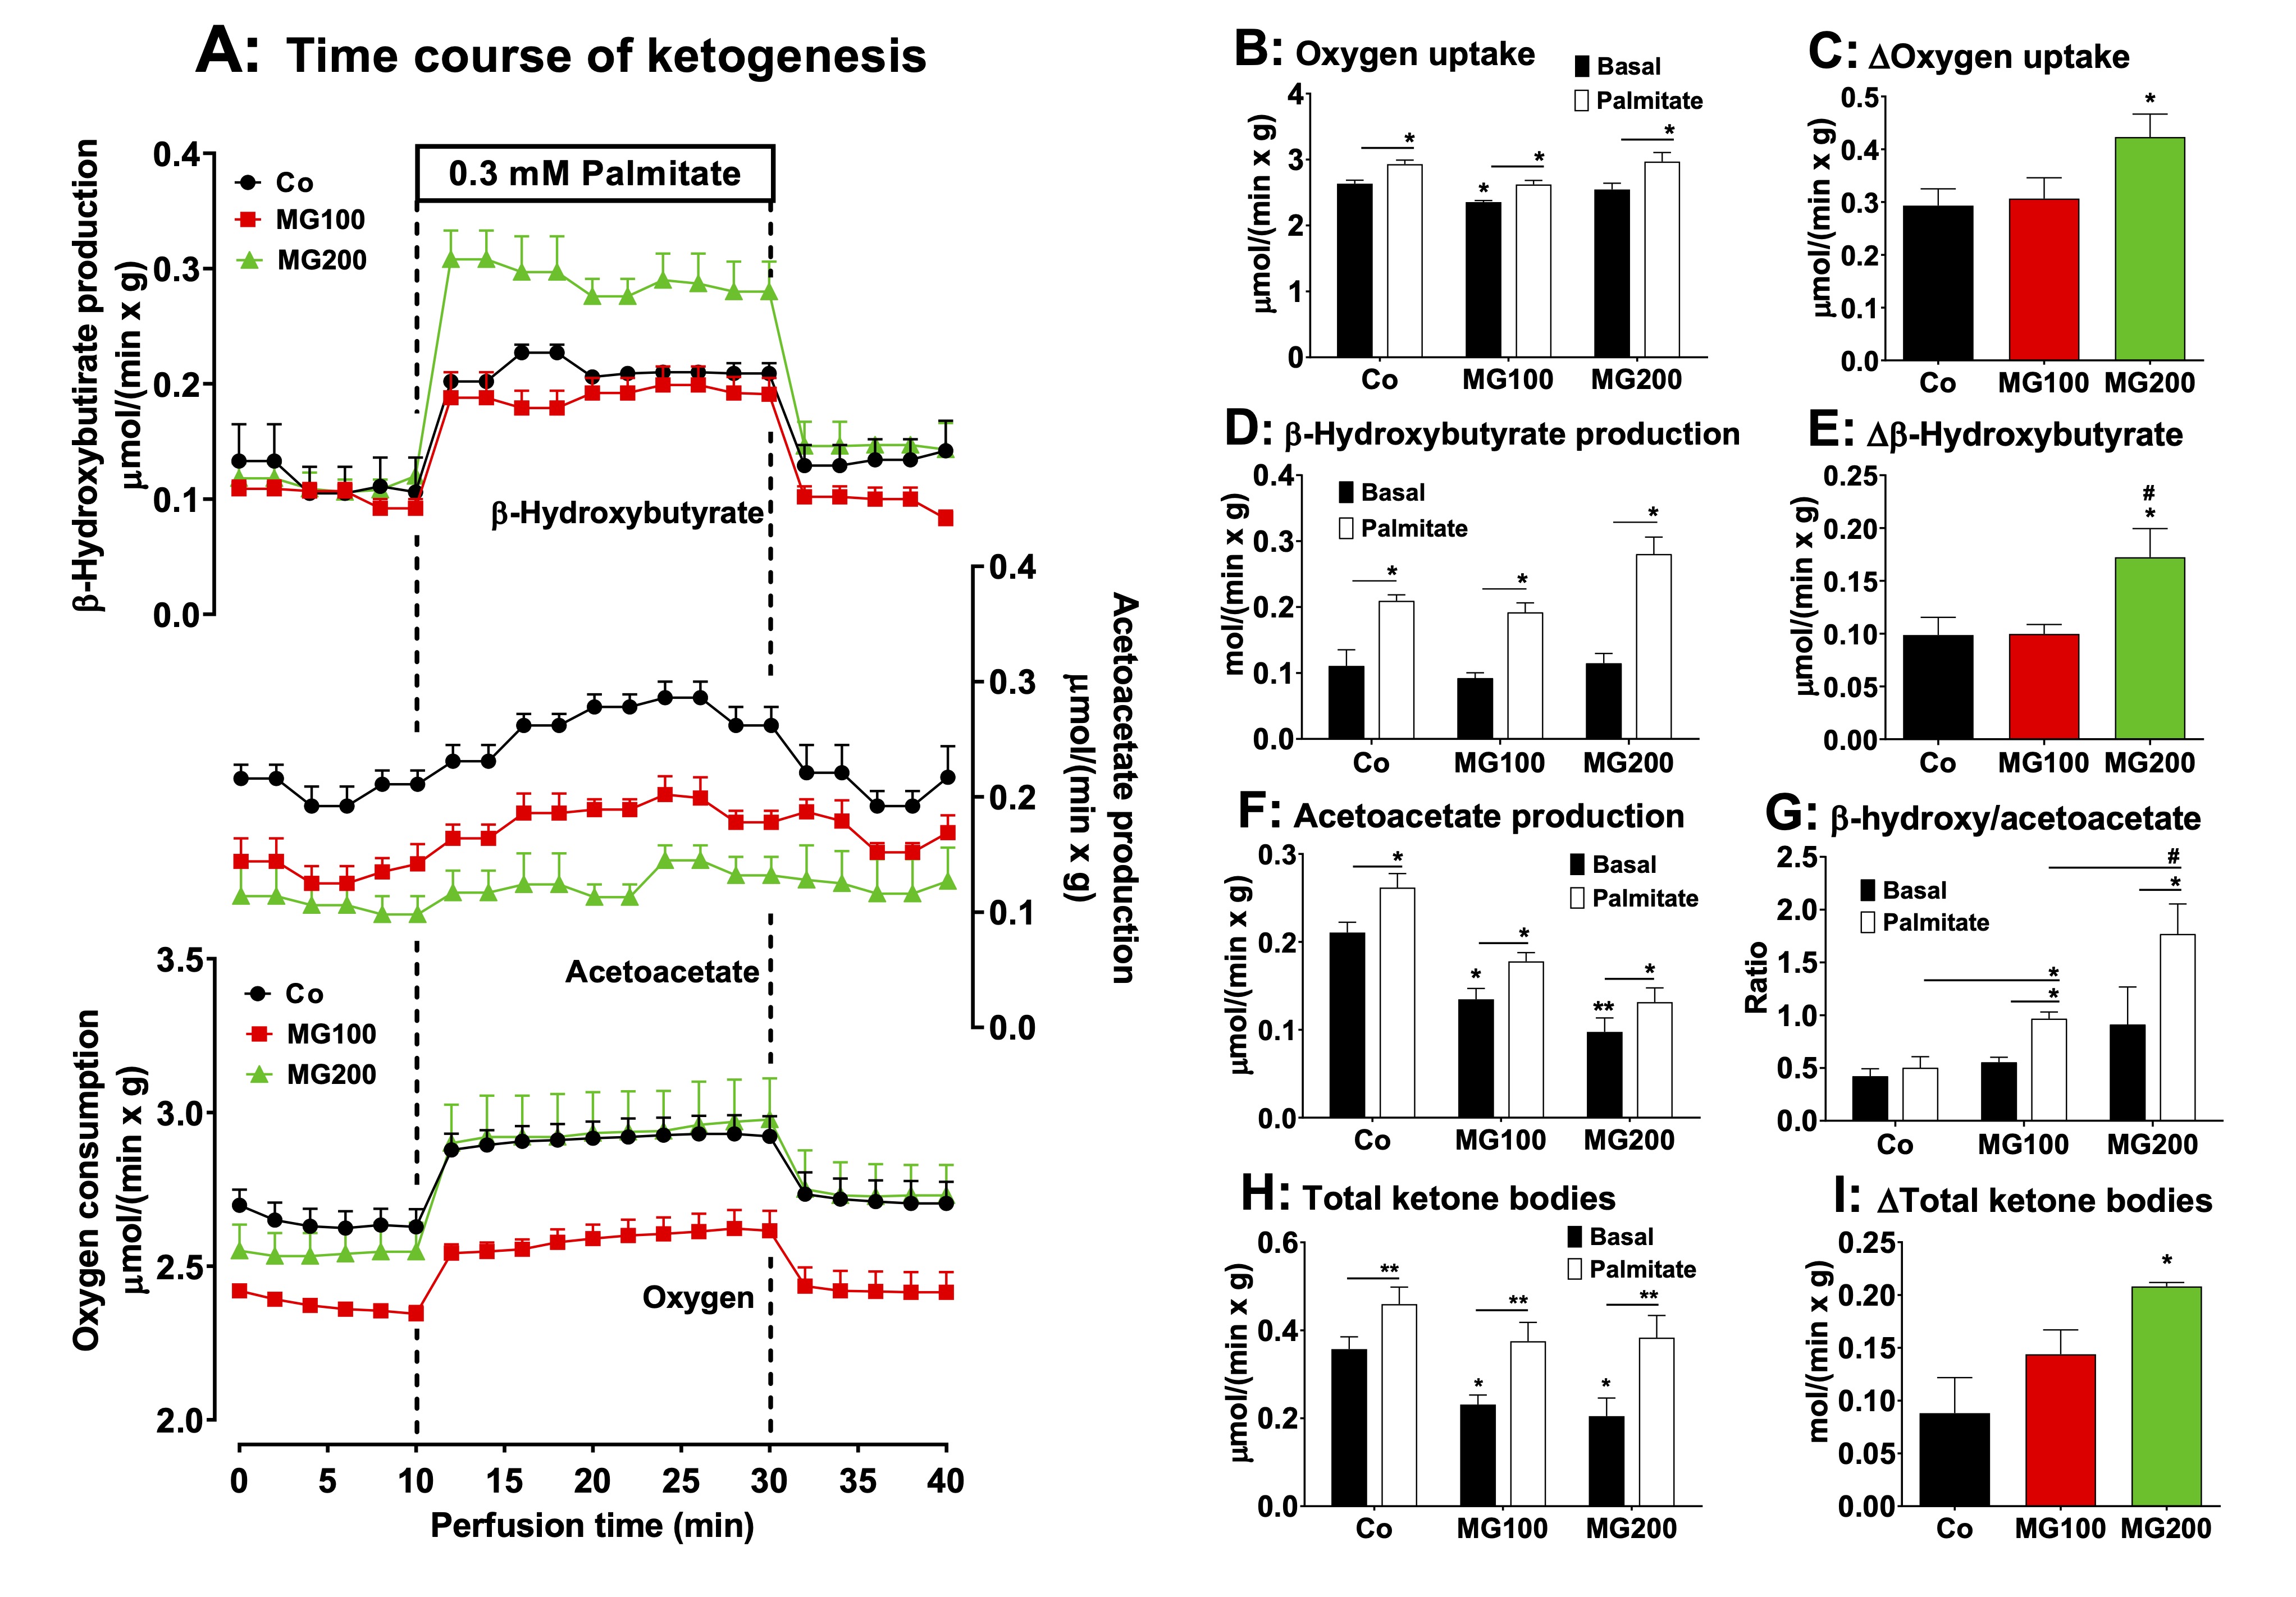
Fig. 8: Effects of MG on ketone bodies production from palmitic acid in the liver. Panel A: time courses of β-hydroxybutyrate and acetoacetate productions, and oxygen consumption due to palmitic acid infusion. The animals received i.p. saline (Co), 100 or 200 mg/kg MG (MG100 and MG200) for 7 days. Livers from 12 h fasted rats were perfused with Krebs/Henseleit bicarbonate buffer in combination with 0.3 mM palmitic acid as indicated by the horizontal box in Panel A. The outflowing perfusate was sampled in regular intervals and analyzed for their contents of β-hydroxybutyrate and acetoacetate. Oxygen uptake was monitored by polarography. Panels B, D, F and H show the values of the liver metabolites output at the basal steady-states (8 min in Panel A; black bars) and the steady-states after palmitic acid infusion (28 min in Panel B; white bars). Panel G shows the values of the β-hydroxybutyrate/acetoacetate ratio in the liver at the basal steady-state and at the steady-state after palmitic acid infusion. The values in Panels C, E and I are the increments of the metabolites productions due to palmitic acid infusion and were calculated from the data in Fig. 8A as [final values at the end of the infusion period with palmitic acid; 28 min] - [basal rates before infusion of palmitic acid; 8 min]. Each datum point represents the mean of 4-5 liver perfusion experiments. *p<0.05 and **p<0.001: different from Co. #p<0.05: difference between MG100 and MG200.
MG modifies the AMPK levels and activation in the adipose tissues
The
AMP-activated protein kinase (AMPK) plays a major role in the
regulation of hepatic and adipose tissue metabolism [52]. Therefore,
the protein levels of AMPK and phosphorylated (activated) AMPK
(p-AMPK) were determined in the liver and adipose tissues. A
representative western blot quantifying the relative levels of AMPK,
p-AMPK, and actin in the samples is shown in Fig. 9A, with the sample
for a single condition loaded into each lane (vertical column). The
results of densitometric analysis of the respective western blots for
AMPK and the p-AMPK/AMPK ratio are shown in Fig. 9B-G. The
p-AMPK/AMPK ratio represents the AMPK activity. MG at both doses did
modify neither the level of AMPK nor the ratio p-AMPK/AMPK in the
liver (Fig. 9B and C). MG at both doses reduced by 70% the AMPK
levels in mesenteric fat, but the ratio p-AMPK/AMPK was not modified
in this tissue (Fig. 9D and E). In the retroperitoneal adipose
tissue, MG at both doses increased by 58% the AMPK levels, but the
ratio p-AMPK/AMPK was increased only in the group that received 200
mg/kg MG (180%; Fig. 9F and G).
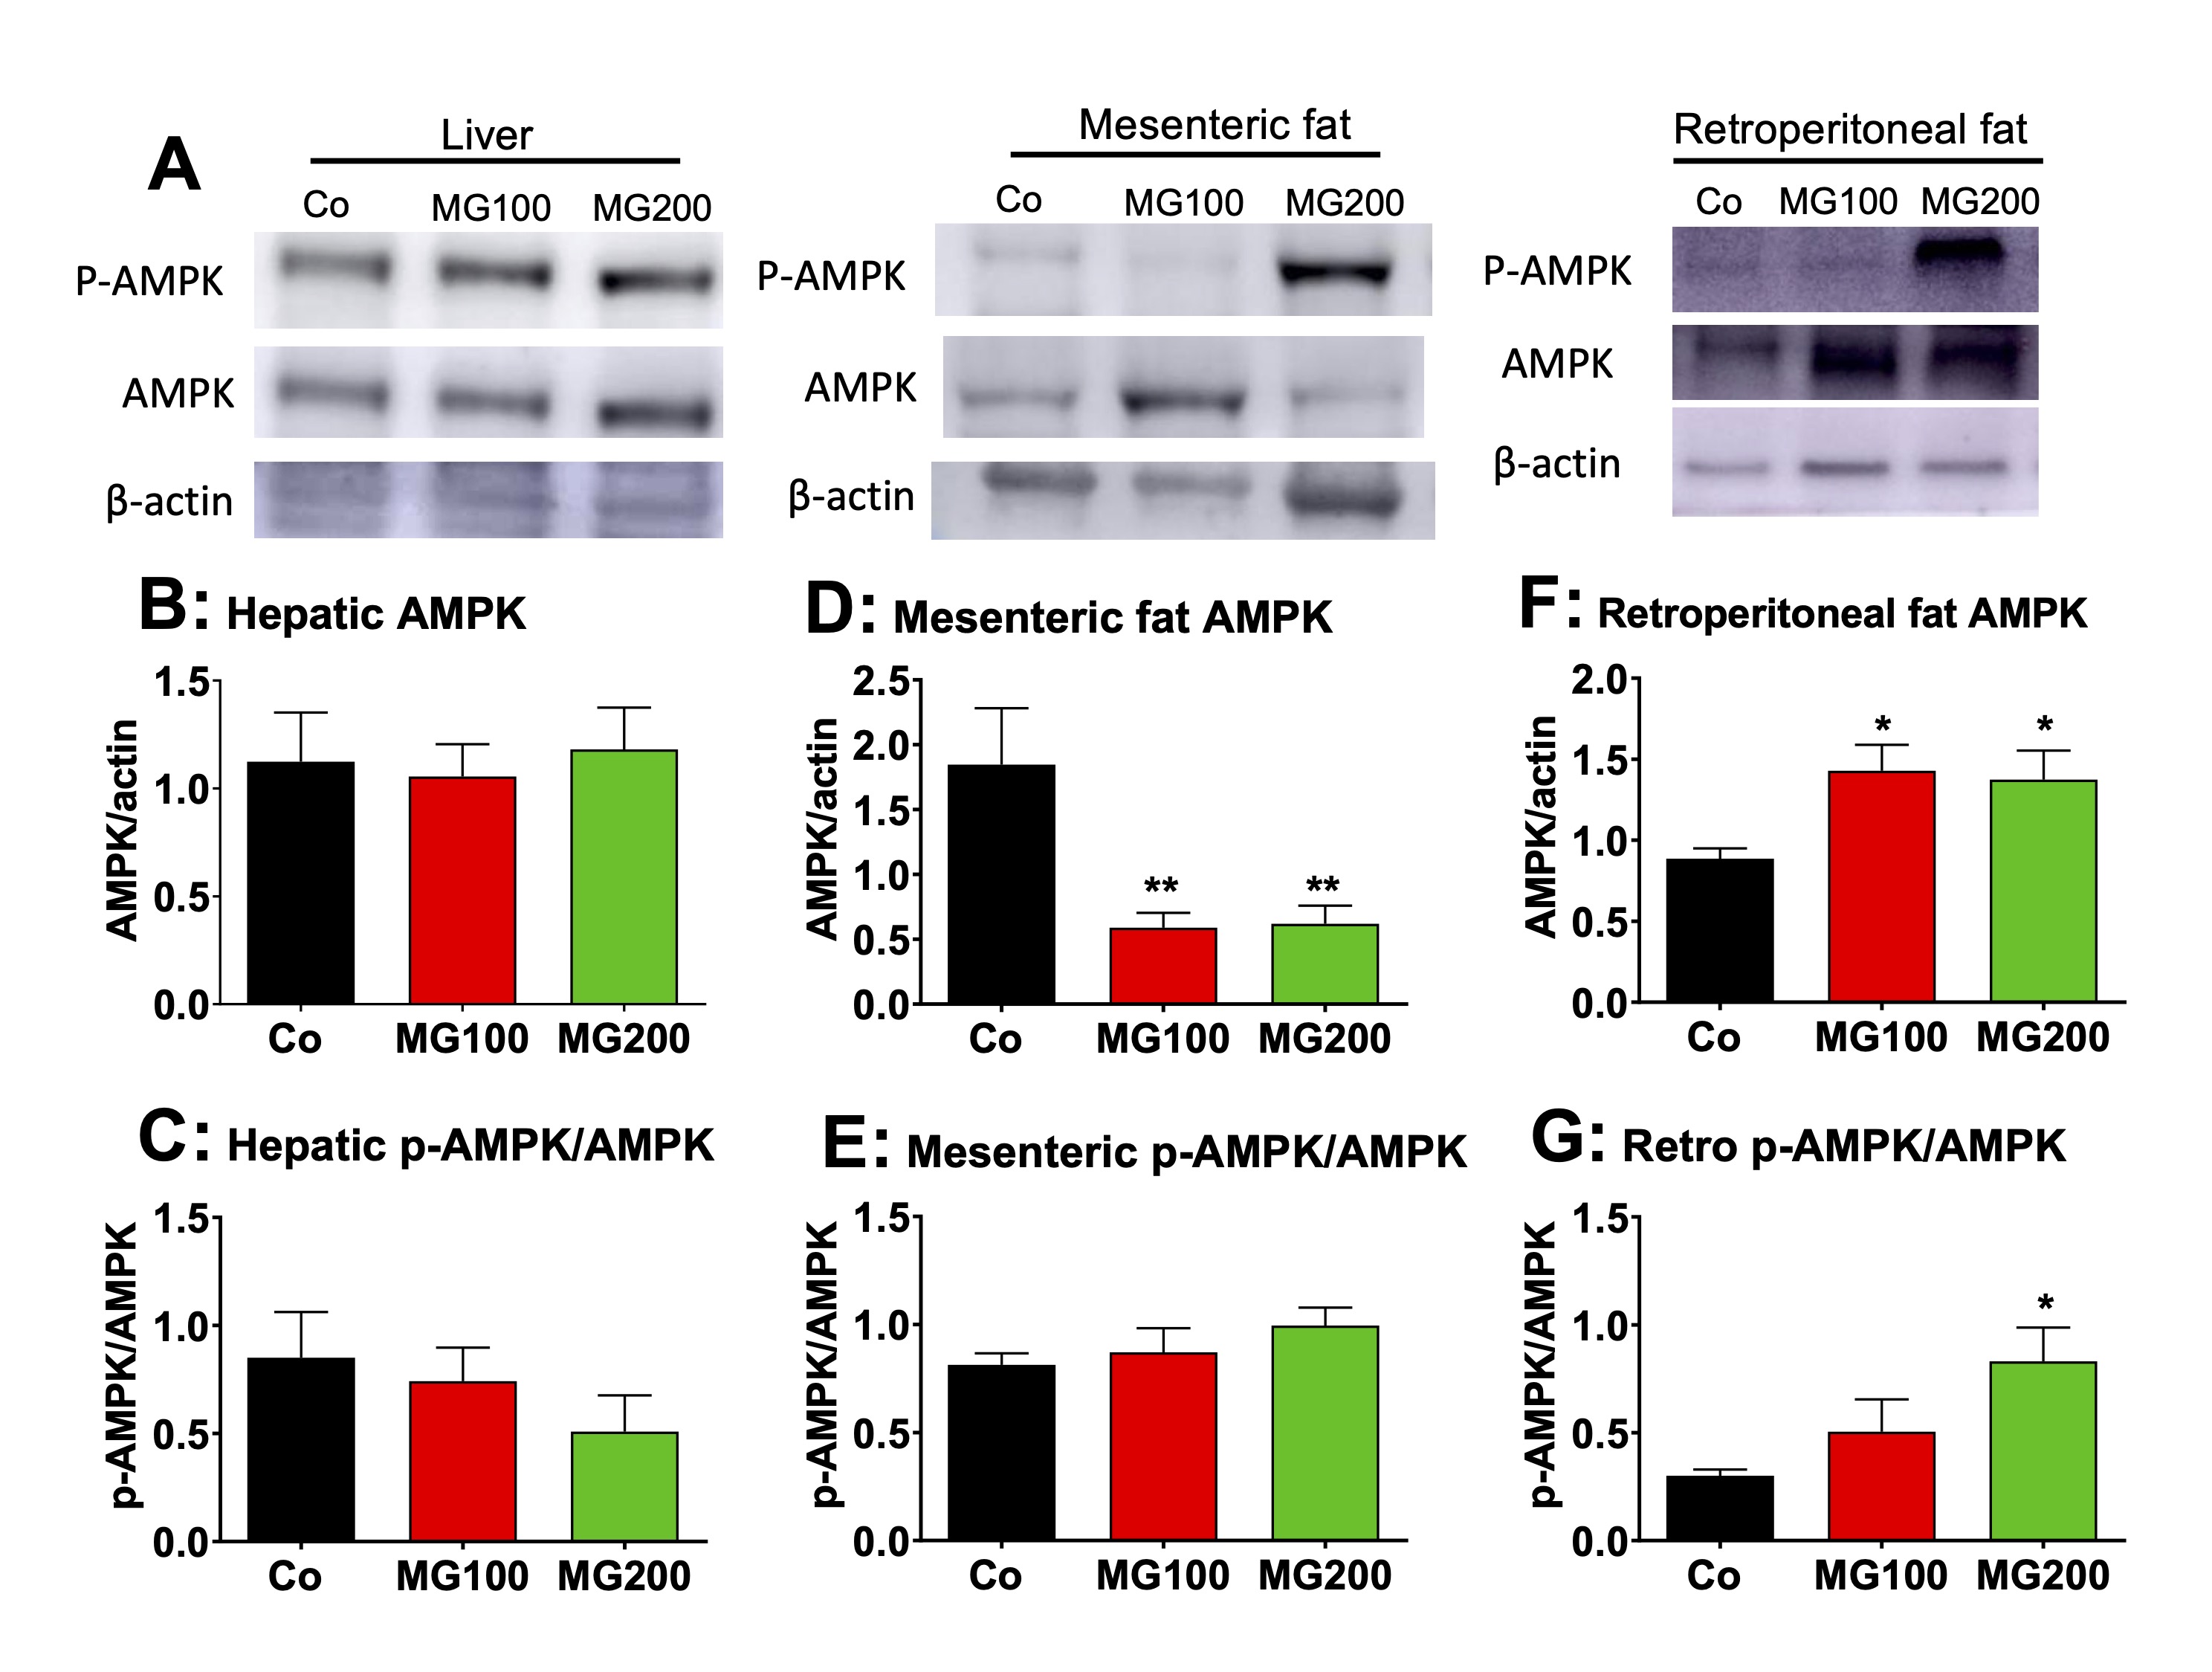
Fig. 9: Western blot analysis of the AMP-activated protein kinase (AMPK) and the phosphorylated (activated) form of AMPK (p-AMPK) in liver and fat tissues. Analyses were performed with the hepatic and fat tissues of 12 h fasted rats which received i.p. saline (Co), 100 or 200 mg/kg MG (MG100 and MG200) for 7 days. A: Representative western blot quantifying the relative levels of AMPK, p-AMPK, and actin, with the sample for each single condition loaded onto each lane (vertical column). The results of densitometric analysis of the respective western blots are presented in Panels B for hepatic AMPK, D for mesenteric fat AMPK and F for retroperitoneal fat AMPK. C, E and G show the p-AMPK/AMPK ratios, respectively, for hepatic, mesenteric fat and retroperitoneal fat tissues. Values are the mean ± SEM of 6 animals. *p<0.05 and **p<0.001: different from Co.
MG causes hepatic inflammation
The
effects of MG on the systemic
inflammation and liver damage were investigated because MG is
associated with
liver inflammation even in the absence of steatosis [53]. The ALT and
AST activities were assayed in the plasma to evaluate liver damage.
The results are shown in Fig.
10A and B. The AST activity was only slightly increased in the plasma
in both groups that received MG (~60%), but no changes were found in
the ALT activity. The latter is regarded as a specific marker of
hepatic damage, but AST may be increased in diseases of other organs
such as muscle and heart [54]. AST elevations under 100% are normally
regarded discrete and not evidence of significant liver damage [54,
55]. The levels of total proteins and albumin, and MPO activity in
the plasma were assayed as markers of systemic inflammation. The MPO
activity was approximately 60% higher in the plasma of animals that
received MG (Fig. 10C). Total protein was reduced only in the plasma
from rats that received 200 mg/kg MG (15%), but albumin levels were
reduced by 12% and 22% respectively in rats that received 100 and 200
mg/kg MG (Fig. 10D and E). As consequence, the albumin/globulin ratio
was reduced by approximately 50% in the plasma of both groups (MG100
and MG200; Fig. 10F). The hepatic MPO activity, an indicative of
polymorphonuclear leukocytes infiltration in the organ, was 100%
higher in rats which received MG (Fig. 10G). The
expressions in terms of mRNA of the interleukin (IL) 1β, IL-6,
tumoral necrosis factor alpha (TNFα)
and sirtuin 1 (SIRT1) were determined in the hepatic tissue of
controls and animals that received 200 mg/kg MG. The results are
shown in Fig. 10H-10J. The expression of IL-1β and TNFα
was not modified, but the
expression of IL-6
mRNA was 5-fold higher in livers from rats that received MG (compared
to the controls). The expression of SIRT1 was downregulated by MG.
SIRT1 is an NAD⁺-dependent
deacetylase enzyme that inhibits NF-κB
and, at the same time, has its expression suppressed by IL-6. Taken
together, these results show that MG causes hepatic and systemic
inflammation.
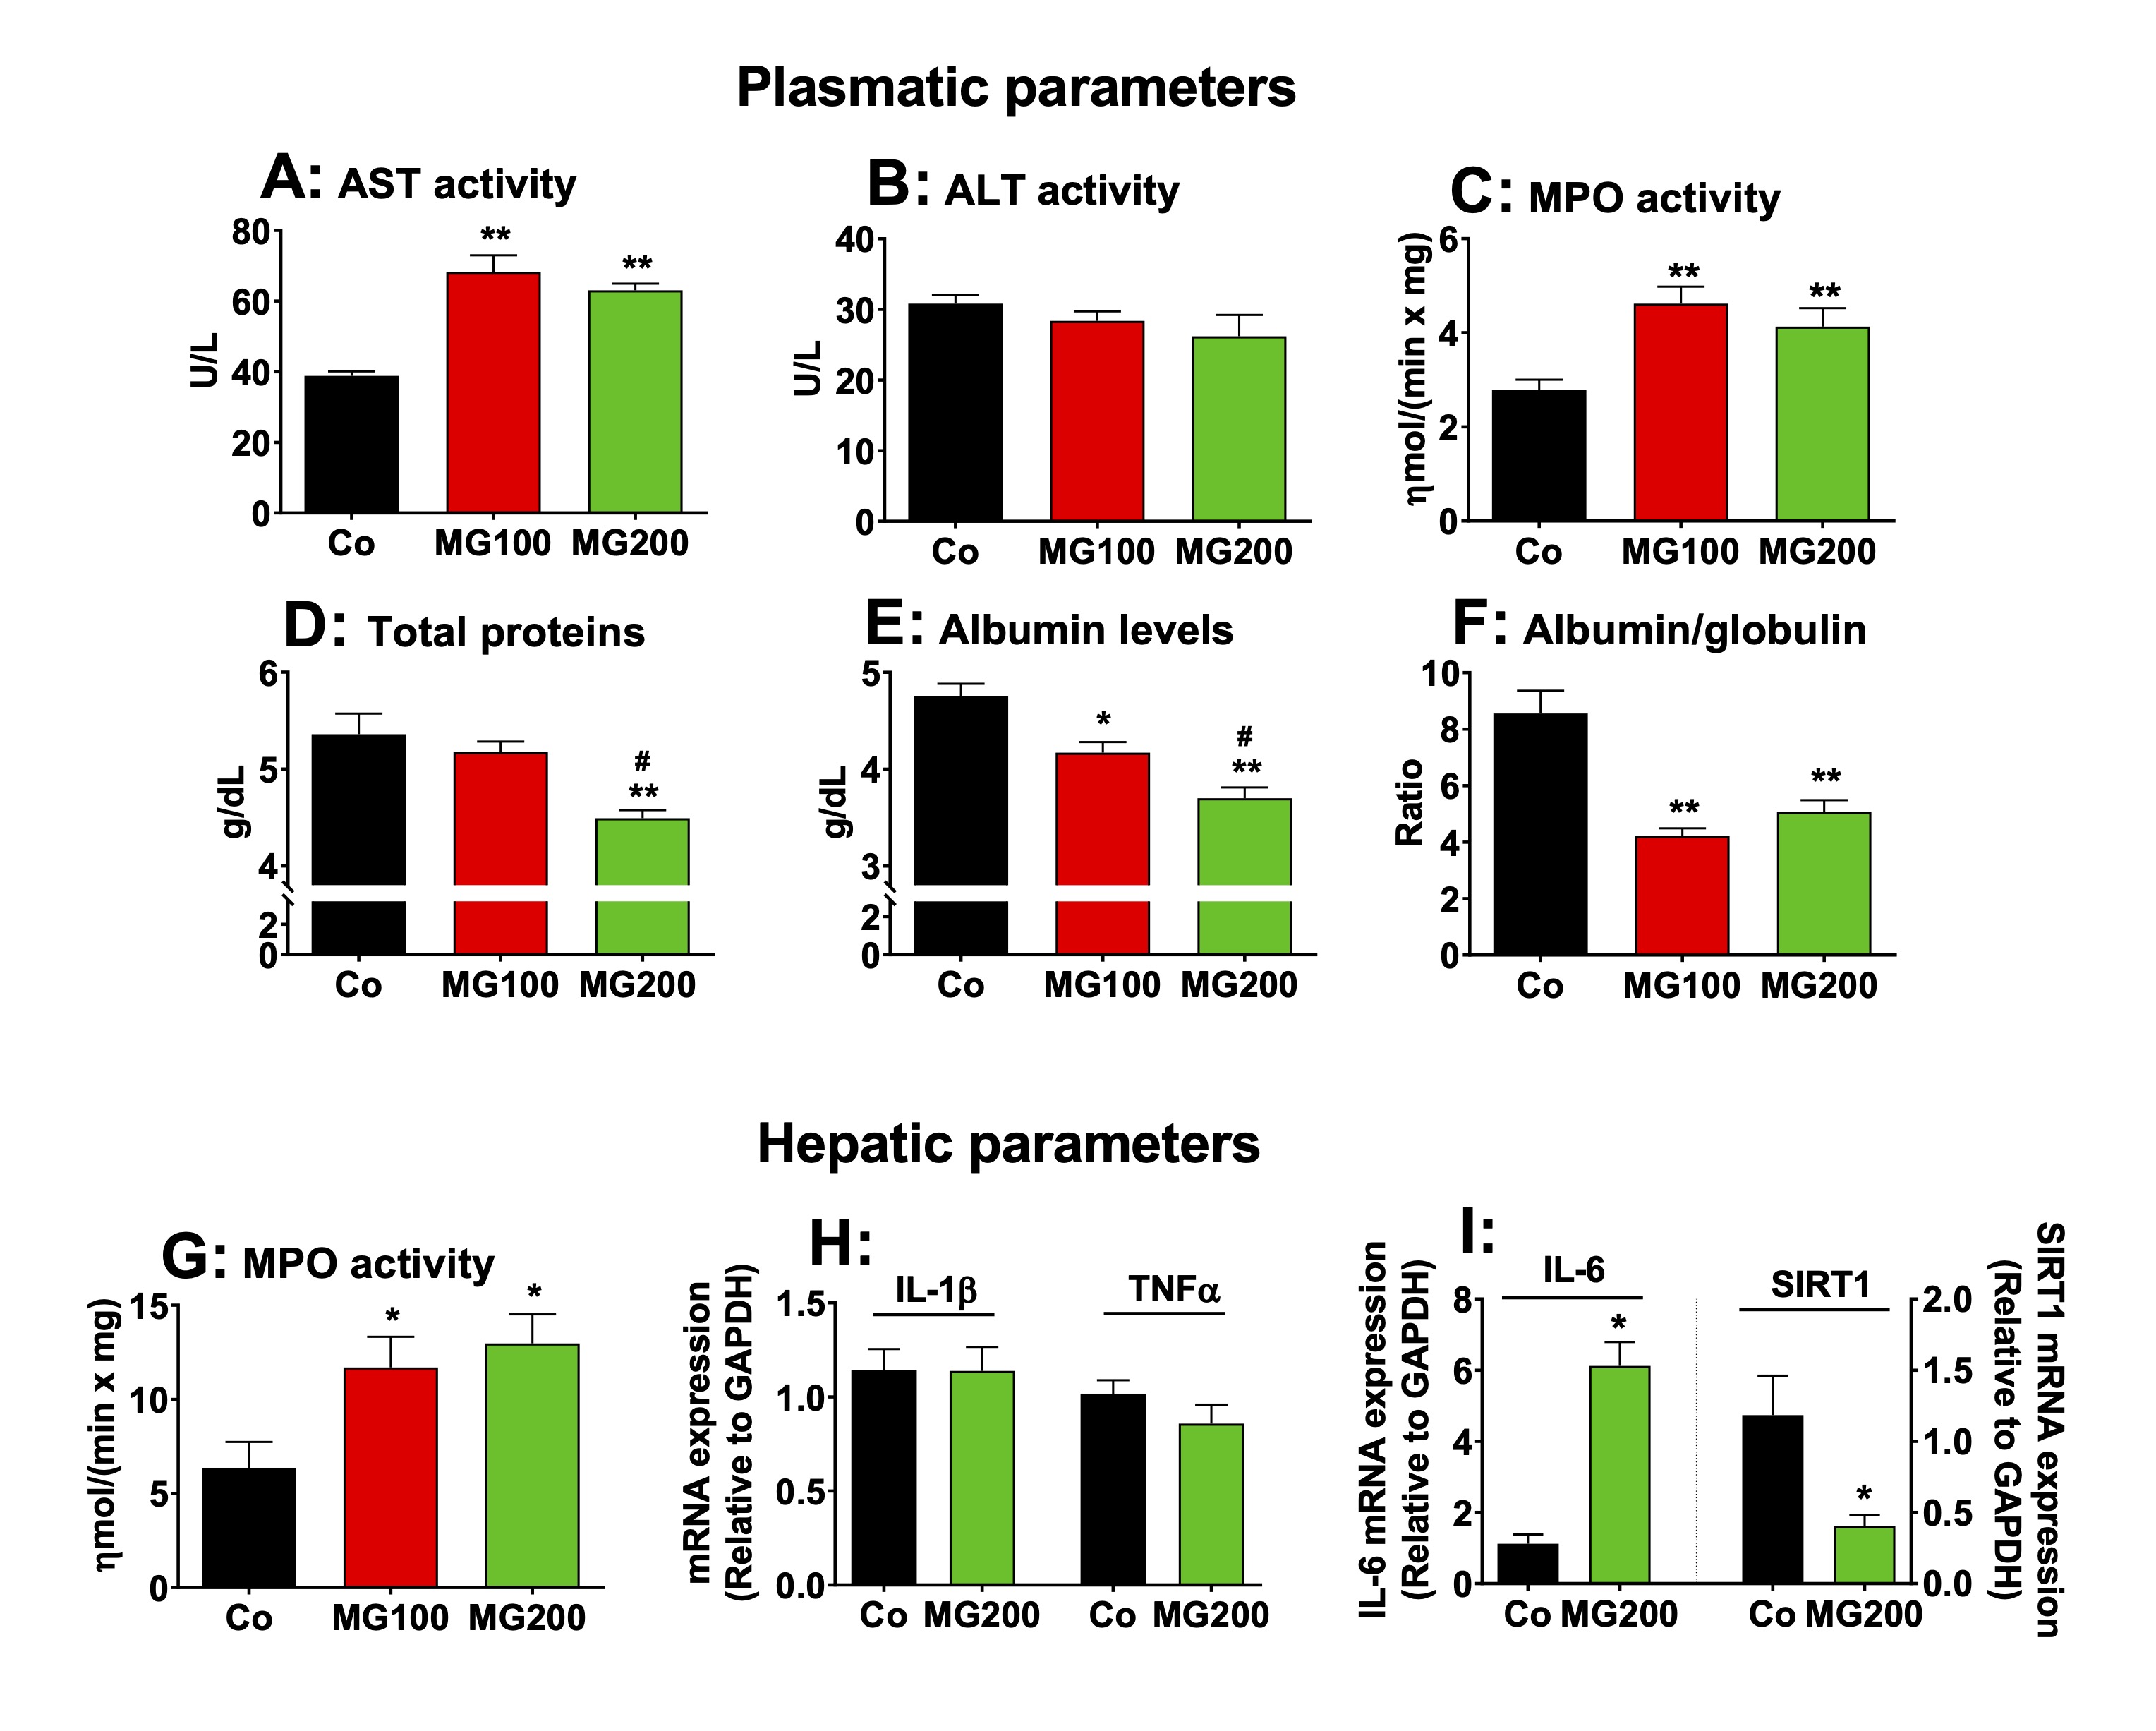
Fig. 10: Markers of systemic and hepatic damage and inflammation. The parameters were determined in plasma and liver of 12 h fasted rats which received i.p. saline (Co), 100 or 200 mg/kg MG (MG100 and MG200) for 7 days. The mRNA expressions of IL-1β, IL-6, TNFα and SIRT1 were determined in the hepatic tissue by qRT-PCR. The activity of myeloperoxidase (MPO) was assayed in plasma and hepatic tissue. The activities of aspartate aminotransferase (AST), alanine aminotransferase (ALT) and the levels of total proteins and albumin were assayed in plasma. The level of globulin was calculated by subtracting albumin from total proteins. Data represent the mean ± SEM of 6 animals. *p<0.05 and **p<0.001: different from Co.
MG promotes systemic and hepatic oxidative stress
The
effects of MG on oxidative stress were assessed in the plasma and
liver. The reason is that inflammation is normally associated with an
increase of oxidative stress in different organs [55-58]. The levels
of protein carbonyl groups, a marker of oxidative injury to proteins,
were 45% higher in the plasma of both groups that received MG
(compared to the control; Fig. 11A). The levels of thiol groups, an
antioxidant marker, were 32% and 48% lower in the plasma from rats
that received 100 and 200 mg/kg MG, respectively (Fig. 11B). TAC was
68% lower in the plasma from rats that received MG, but FRAP was
lower (30%) only in the group that received 200 mg/kg MG (Fig.11C).
Figs. 11D-N show the oxidative status of the liver. The levels of
protein carbonyl groups were 47% and 160% higher, respectively, in
the livers from rats that received 100 and 200 mg/kg MG (Fig. 11D).
The levels of ROS were 47% higher in the liver of both groups that
received MG (Fig. 11E). The catalase activity was 20% and 40% lower,
respectively, in the livers from rats that received 100 and 200 mg/kg
MG (Fig. 11F). The SOD activity was lower (20%) only in the liver
from rats that received 200 mg/kg MG (Fig. 11F). Since catalase
activity was more strongly inhibited, its mRNA expression was
measured in the liver of rats treated with 200 mg/kg MG and was found
to be reduced by 80% (Fig. 11J). The hepatic levels of GSH were not
different among all groups, but the levels of GSSG were 25% higher in
the group that received the highest dose of MG (Fig. 11G and H). In
consequence, the GSH/GSSG ratio was 36% lower in the livers of this
group (Fig. 11I), indicating an impairment in GSH regeneration.
The GSH/GSSG ratio is affected by the balance between enzymes
involved in GSH consumption and generation. In order to explain this
finding, the
expression in terms of mRNA of GPx1, GR, HO-1 and GSTA3 was
determined in the hepatic tissue of controls and animals that
received 200 mg/kg MG. The results are shown in Fig. 11K-N. The
expressions of GR and GPx1 were not modified, but GSTA3 expression in
the liver was 50% lower in rats that received 200 mg/kg MG compared
to the controls. Notably, 200 mg/kg MG increased hepatic HO-1
expression by 75%. The total glutathione, however, was not modified
by MG (results not shown). These results show that MG increases
systemic and hepatic oxidative stress.
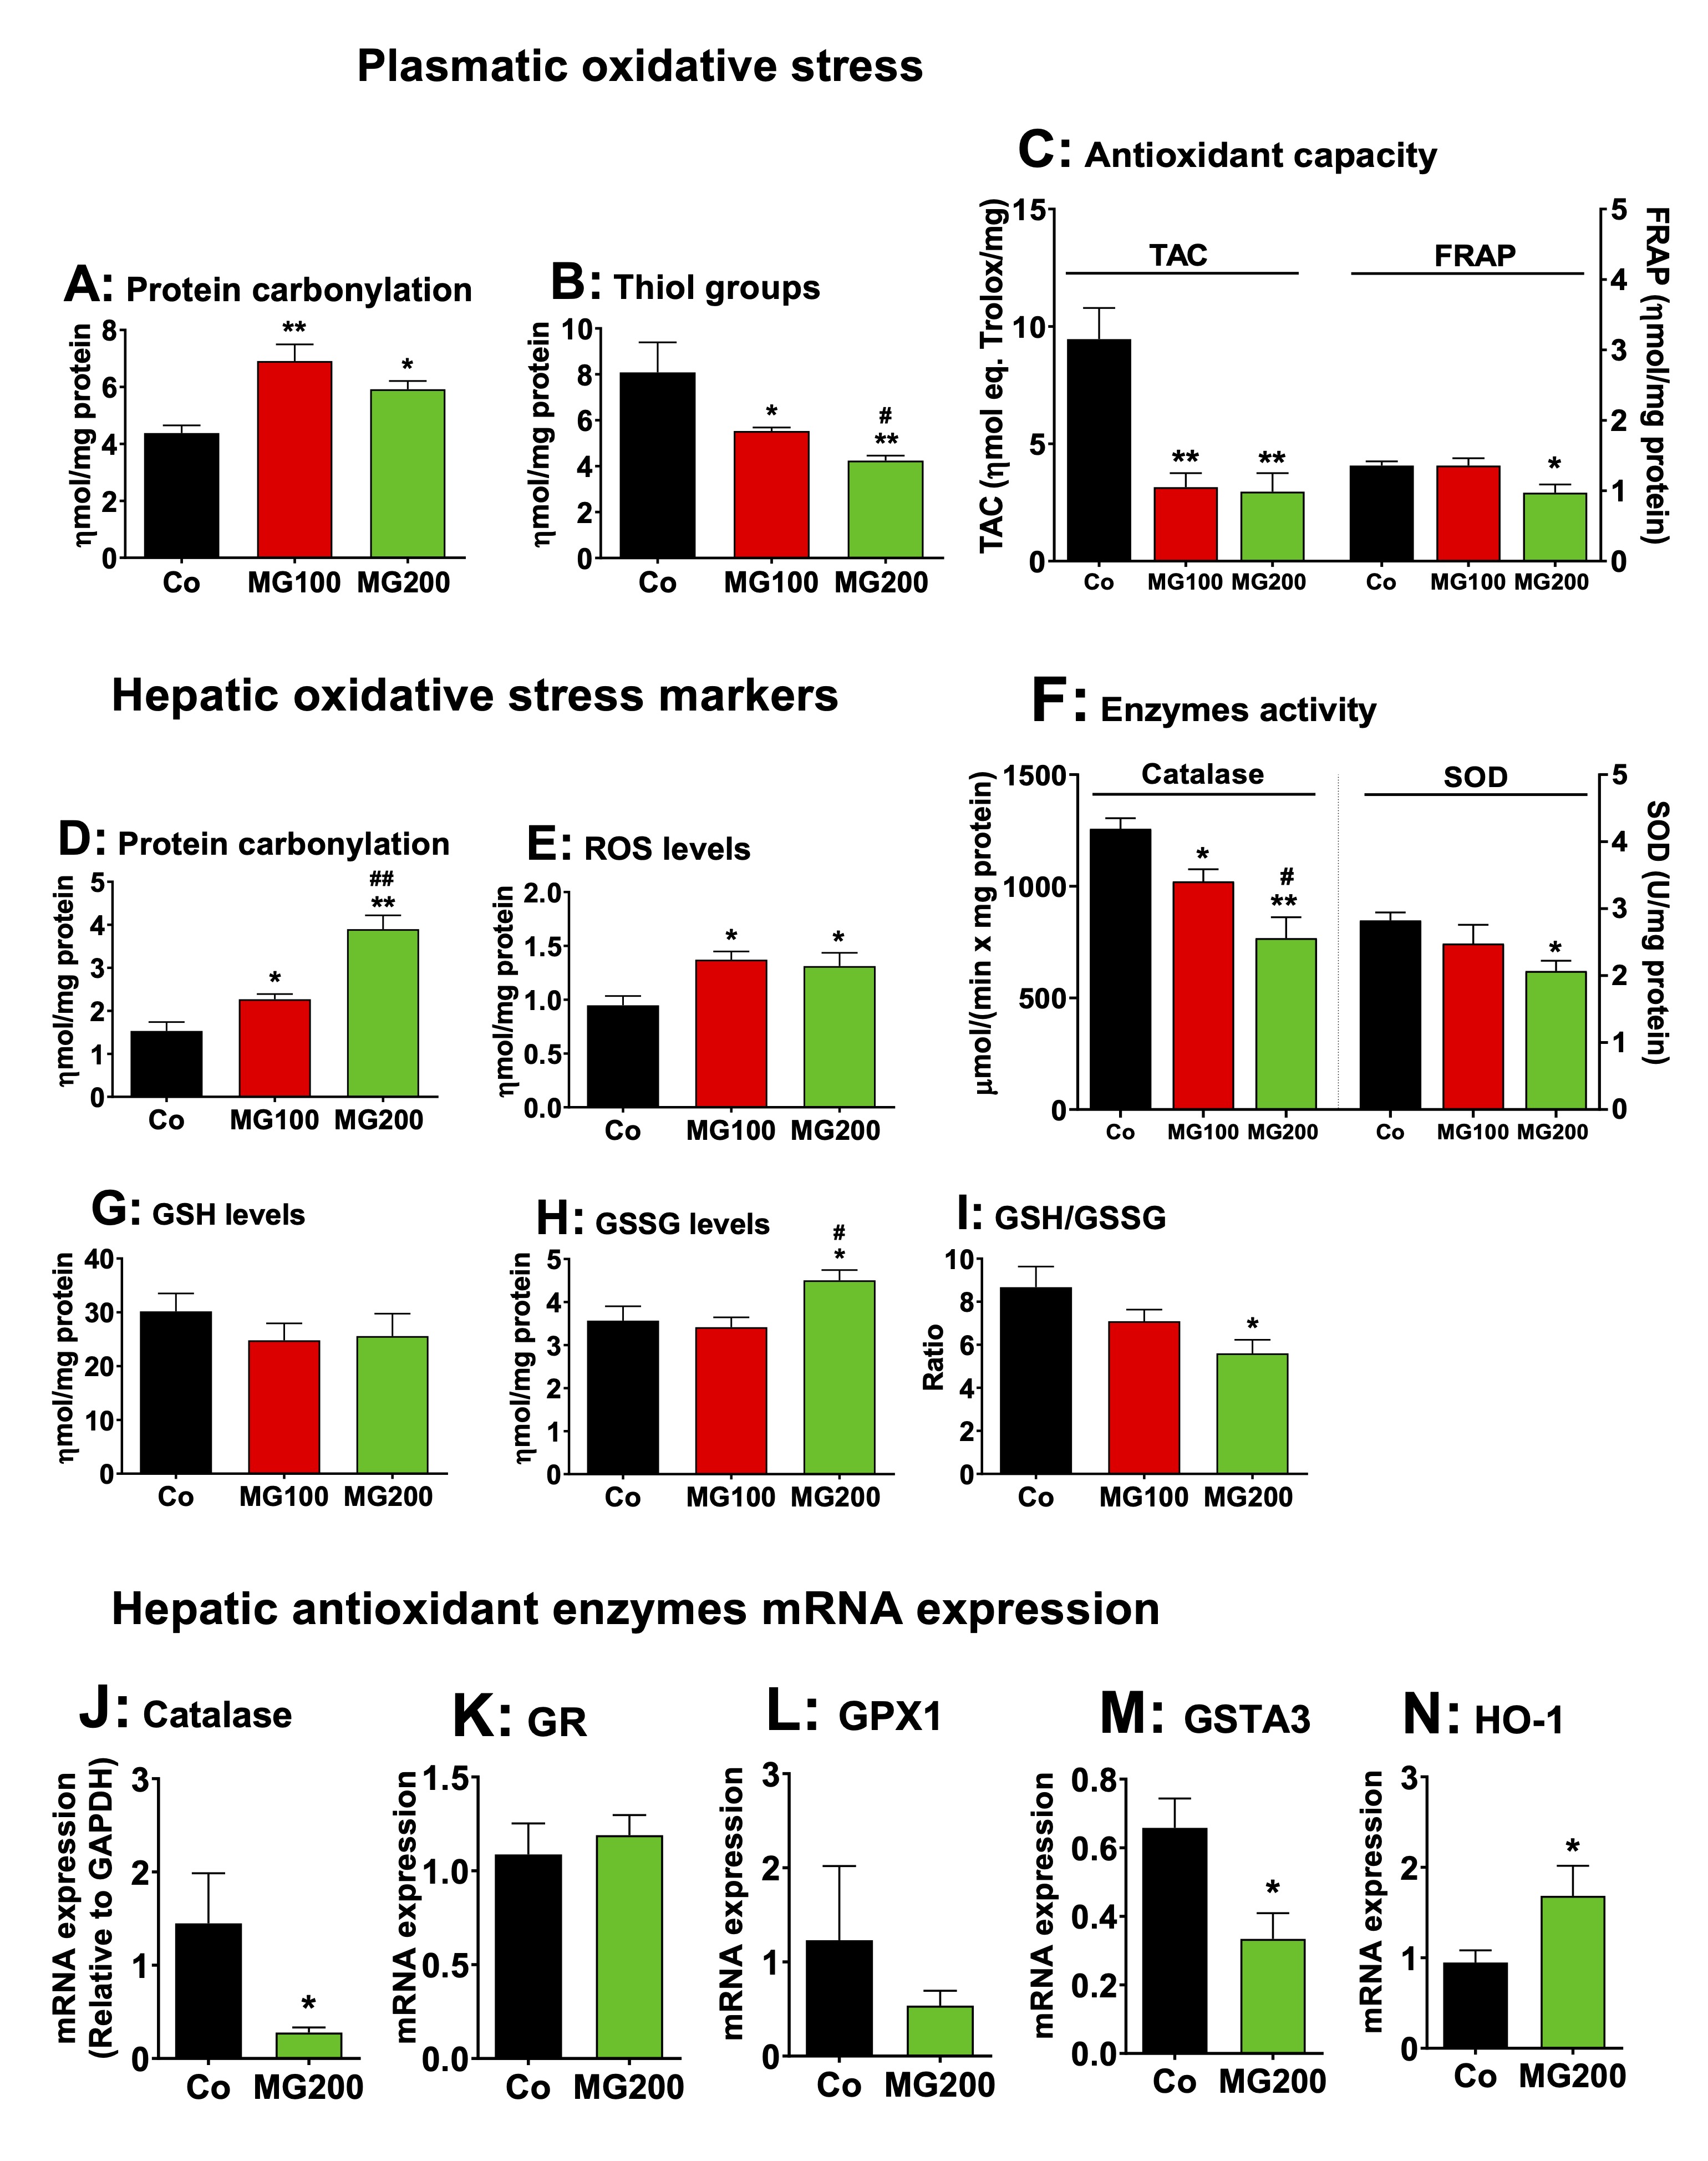
Fig. 11: Effects of MG on the oxidative status of plasma and liver. The parameters were determined in the plasma and liver of 12 h fasted rats which received i.p. saline (Co), 100 or 200 mg/kg MG (MG100 and MG200) for 7 days. Panels A – C present markers of plasmatic oxidative stress, respectively protein carbonylation (A), thiol groups (B), TAC (total antioxidant activity of plasma) and FRAP (ferric reduction capacity of plasma) (C). Panels D – I show markers of hepatic oxidative stress, respectively protein carbonylation (D), ROS content (E), catalase and SOD activity (F), GSH (reduced glutathione) content (G), GSSG (oxidized glutathione) content (H) and GSH/GSSG ratio (I). The mRNA expressions (normalized to GAPDH) of hepatic antioxidant enzymes are shown in panels J (Cat: catalase), K (GR: glutathione reductase), L (GPx1: glutathione peroxidase 1), M (GSTA3: glutathione-S-transferase) and N (heme oxigenase 1, HO-1). Data represent the mean ± SEM of 5-8 animals. *p<0.05 and **p<0.001: different from Co. #p<0.05 and ##p<0.001: difference between MG100 and MG200.
MG increases the AGE content and upregulates RAGE expression in the liver
The
levels of MG and AGE were quantified in the plasma and liver of rats
to measure the extent to which these compounds increased in these
tissues. The peak of MG concentration in plasma is reported to be
reached at 4 h after a single oral dose, returning to baseline levels
8 h after, regardless of whether 100 or 200 mg/kg was administered
[25]. A high MG level in the plasma of rats is sustained after 3
consecutive days of administering a 100 mg/kg dose [25]. Then, the
levels of MG were assayed in the plasma of rats 4 h and 12 h after
the administration of the 200 mg/kg dose on the seventh day (the last
day of MG administration). The results are shown in Fig. 12A. The
control rats showed MG levels ranging between 0.4 and 0.7 ng/mL. MG
administration raised their plasma levels to approximately 2 ng/mL at
both 4 and 12 hours post-dosing. The levels of MG were 70% higher in
the liver of rats 12 h after the administration of the 200 mg/kg dose
on the seventh day (Fig. 12B).
The
content of AGE generated by the reaction of MG with proteins was
determined in the plasma and liver. The results are show in Figs. 12C
and 12D. The plasma levels of AGE were 20% and 72% higher
respectively in the groups that received 100 and 200 mg/kg MG,
respectively (Fig. 12C). In the liver, the levels of AGE were higher
(14%) only in the rats that received 200 mg/kg MG (Fig. 12D). Next,
the contents of CML and MG-H1 were assayed in the liver. These
compounds are the main AGE associated with proteins generated by
reaction with MG [3]. A
representative dot blot quantifying the relative levels of MG-H1 and
CML in liver samples is shown in Fig. 12E, with the samples for each
condition displayed vertically. The results of the densitometric
analysis of the respective dot blots for MG-H1 and CML are presented
in Figs. 12F and 12G, respectively. The levels of MG-H1 were 55%
higher in the liver from rats that received 200 mg/kg MG, but the
levels of CML were approximately 50% higher in the livers of both
groups that received MG. The expressions of RAGE, GLO-I and GLO-II in
terms of mRNA were assayed only in the livers from rats which
received 200 mg/kg MG. The results are shown in Fig. 12H-J. The
expression of RAGE was three-fold higher in the liver from rats that
received 200 mg/kg MG (compared to Co). The expression of GLO-I was
32% lower in the livers from rats that received MG, but the
expression of GLO-II was not modified. These results reveal that MG
administration increases AGE production in plasma and liver while
upregulating hepatic RAGE expression, a phenomenon associated with
increased inflammation and oxidative stress.
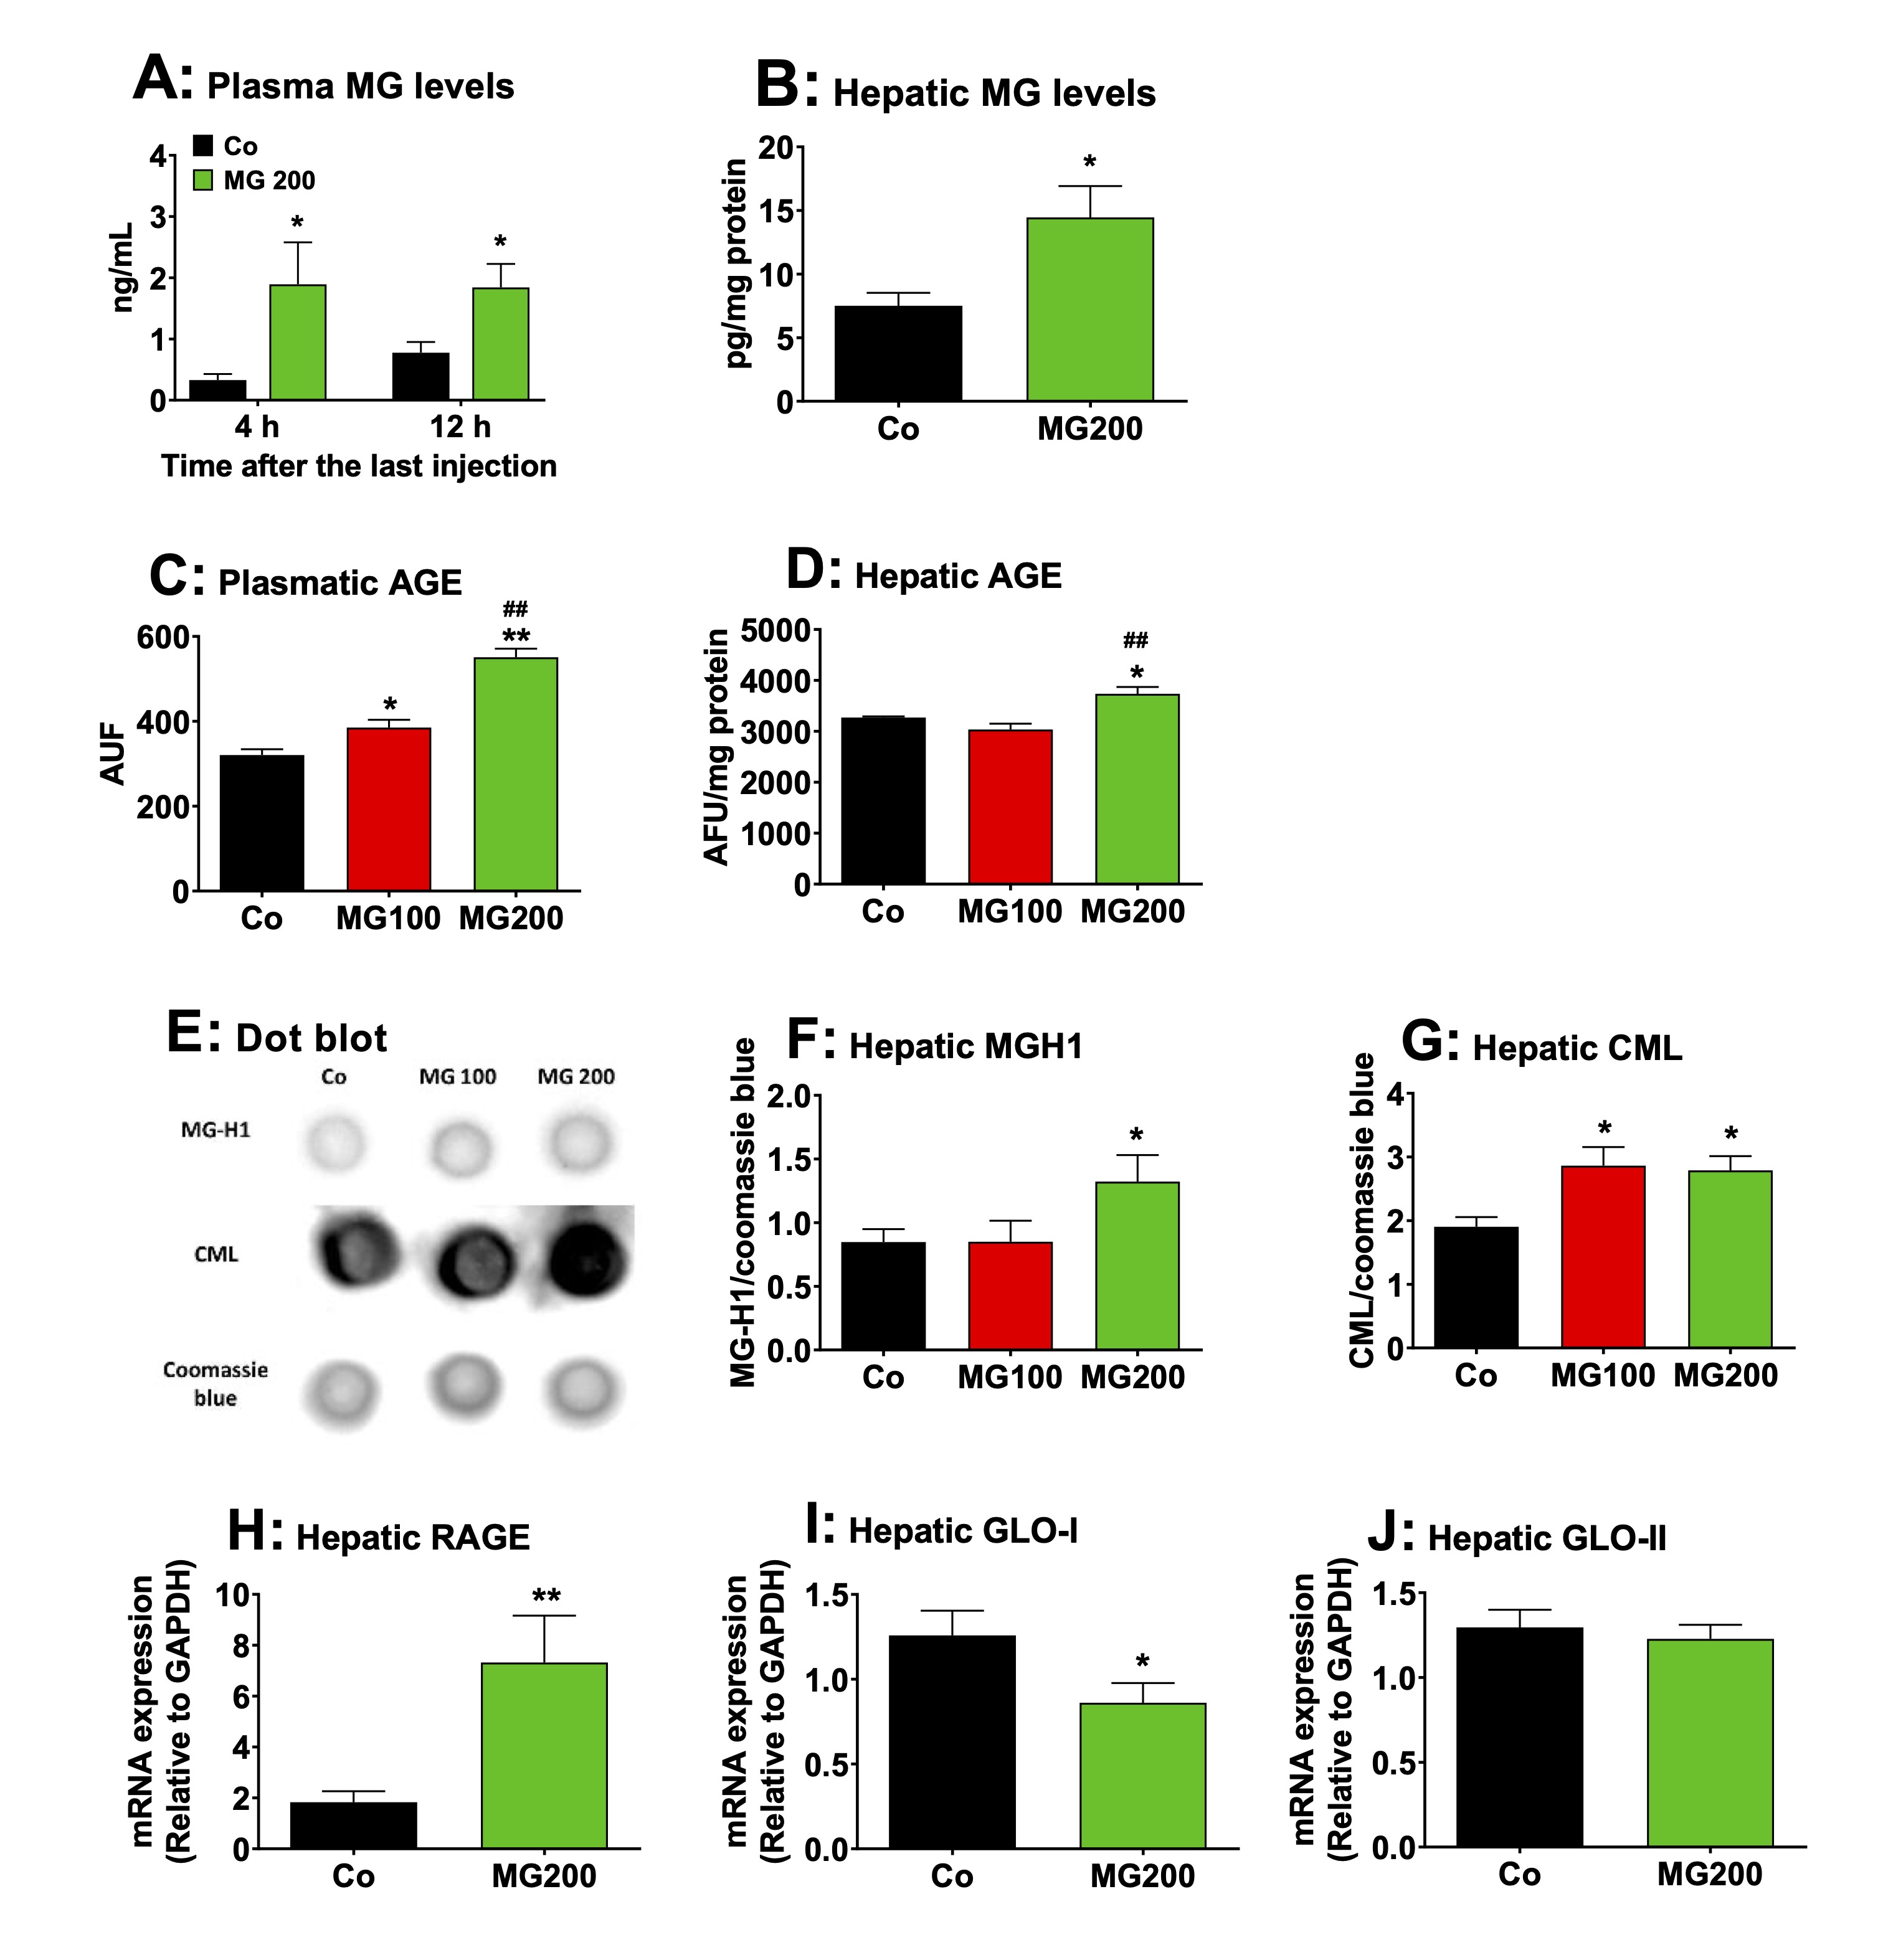
Fig. 12: Effects of MG on AGE content, RAGE expression and glyoxalases activity in the liver. A and B: levels of MG in plasma and liver, respectively. Plasmatic MG was assayed after 4 and 12h after the last injection of MG in fasted rats. The remaining analyses were performed in liver and plasma 12h after the last injection of MG in fasted rats, which received i.p. saline (Co), 100 or 200 mg/kg MG (MG100 and MG200), for 7 days. C and D: the levels of AGE in plasma and liver, respectively. E: representative dot blot quantifying the relative levels of carboxymethyllysine (CML), methylglyoxal-hydroimidazolone 1 (MG-H1) and coomassie blue, with the sample for each single condition loaded onto each lane (vertical column). The results of densitometric analysis of the respective dot blot are presented in Panels F for MG-H1 and G for CML. H: the RAGE mRNA expression in the liver. I and J: expression of glyoxalase I (GLO-I) and glyoxalase II (GLO-II) in the liver, respectively. Values are the mean ± SEM of 4-8 animals. *p<0.05 and **p<0.001: different from Co. ##p<0.001: difference between MG100 and MG200.
MG and AGE increase human lymphocyte viability
The
content of MG and AGE was increased in plasma and MG upregulated
inflammatory pathways in the liver and systemically. Lymphocytes are
directly associated with the immune response to inflammation and they
make up around 40% of the circulating white blood cells in humans.
This leads to the hypothesis that both MG and MG-derived AGE may
stimulate the proliferation of these cells and modify their
viability. Human lymphocytes were used to test this hypothesis. The
characterization of the AGE was performed to verify whether its
preparation was adequate. The AGE preparations were characterized in
relation to non-oxidized amino acids, Maillard compounds, protein
carbonyl groups, protein sulfhydryl groups, N-oxidation of protein
amino acids, and contents of CML and MGH1. The results are presented
as Supplementary Materials (Fig. S1) and show that the method used
was effective in producing AGE.
The
cells were cultured in the presence of MG or AGE by 24 or 48 h, and
their viability was evaluated by the MTT method. The results are
shown in Fig. 13. Incubation for 24 h with MG up to 100 µM and MMS
(positive control) reduced only slightly viability (10% to 20%).
However, more pronounced reductions were found with MG at the
concentrations of 500 µM (30%) and 1000-2000 µM (> 80%; Fig.
13A). When the incubation time was increased to 48 h, the viability
of the lymphocytes was reduced by approximately 70% with 1000 and
2000 µM MG and MMS. Lower concentrations of MG (5–500 µM),
however, increased viability by approximately 40% (Fig. 13B). For
investigating lymphocyte viability in the presence of AGE, the latter
were produced as described in section 2.17.
Lymphocytes viability was evaluated with
BSA (negative AGE), AGE-L and AGE-H at the concentrations of 0.1, 1.0
and 2.5 mg/mL, respectively, during 24 and 48 h.
The results are shown in Figs. 13C and 13D. Incubation of lymphocytes
for24 h with BSA increased viability by approximately 45%, but
incubation with AGE-L and AGE-H caused increases of 100% and 120%,
respectively (Fig. 13C). BSA treatment did not increase lymphocyte
viability when the incubation was extended further to 48 h, but the
AGE-L and AGE-H treatment still promoted 20 to 30% increases,
respectively, during this extended time period (Fig. 13D).
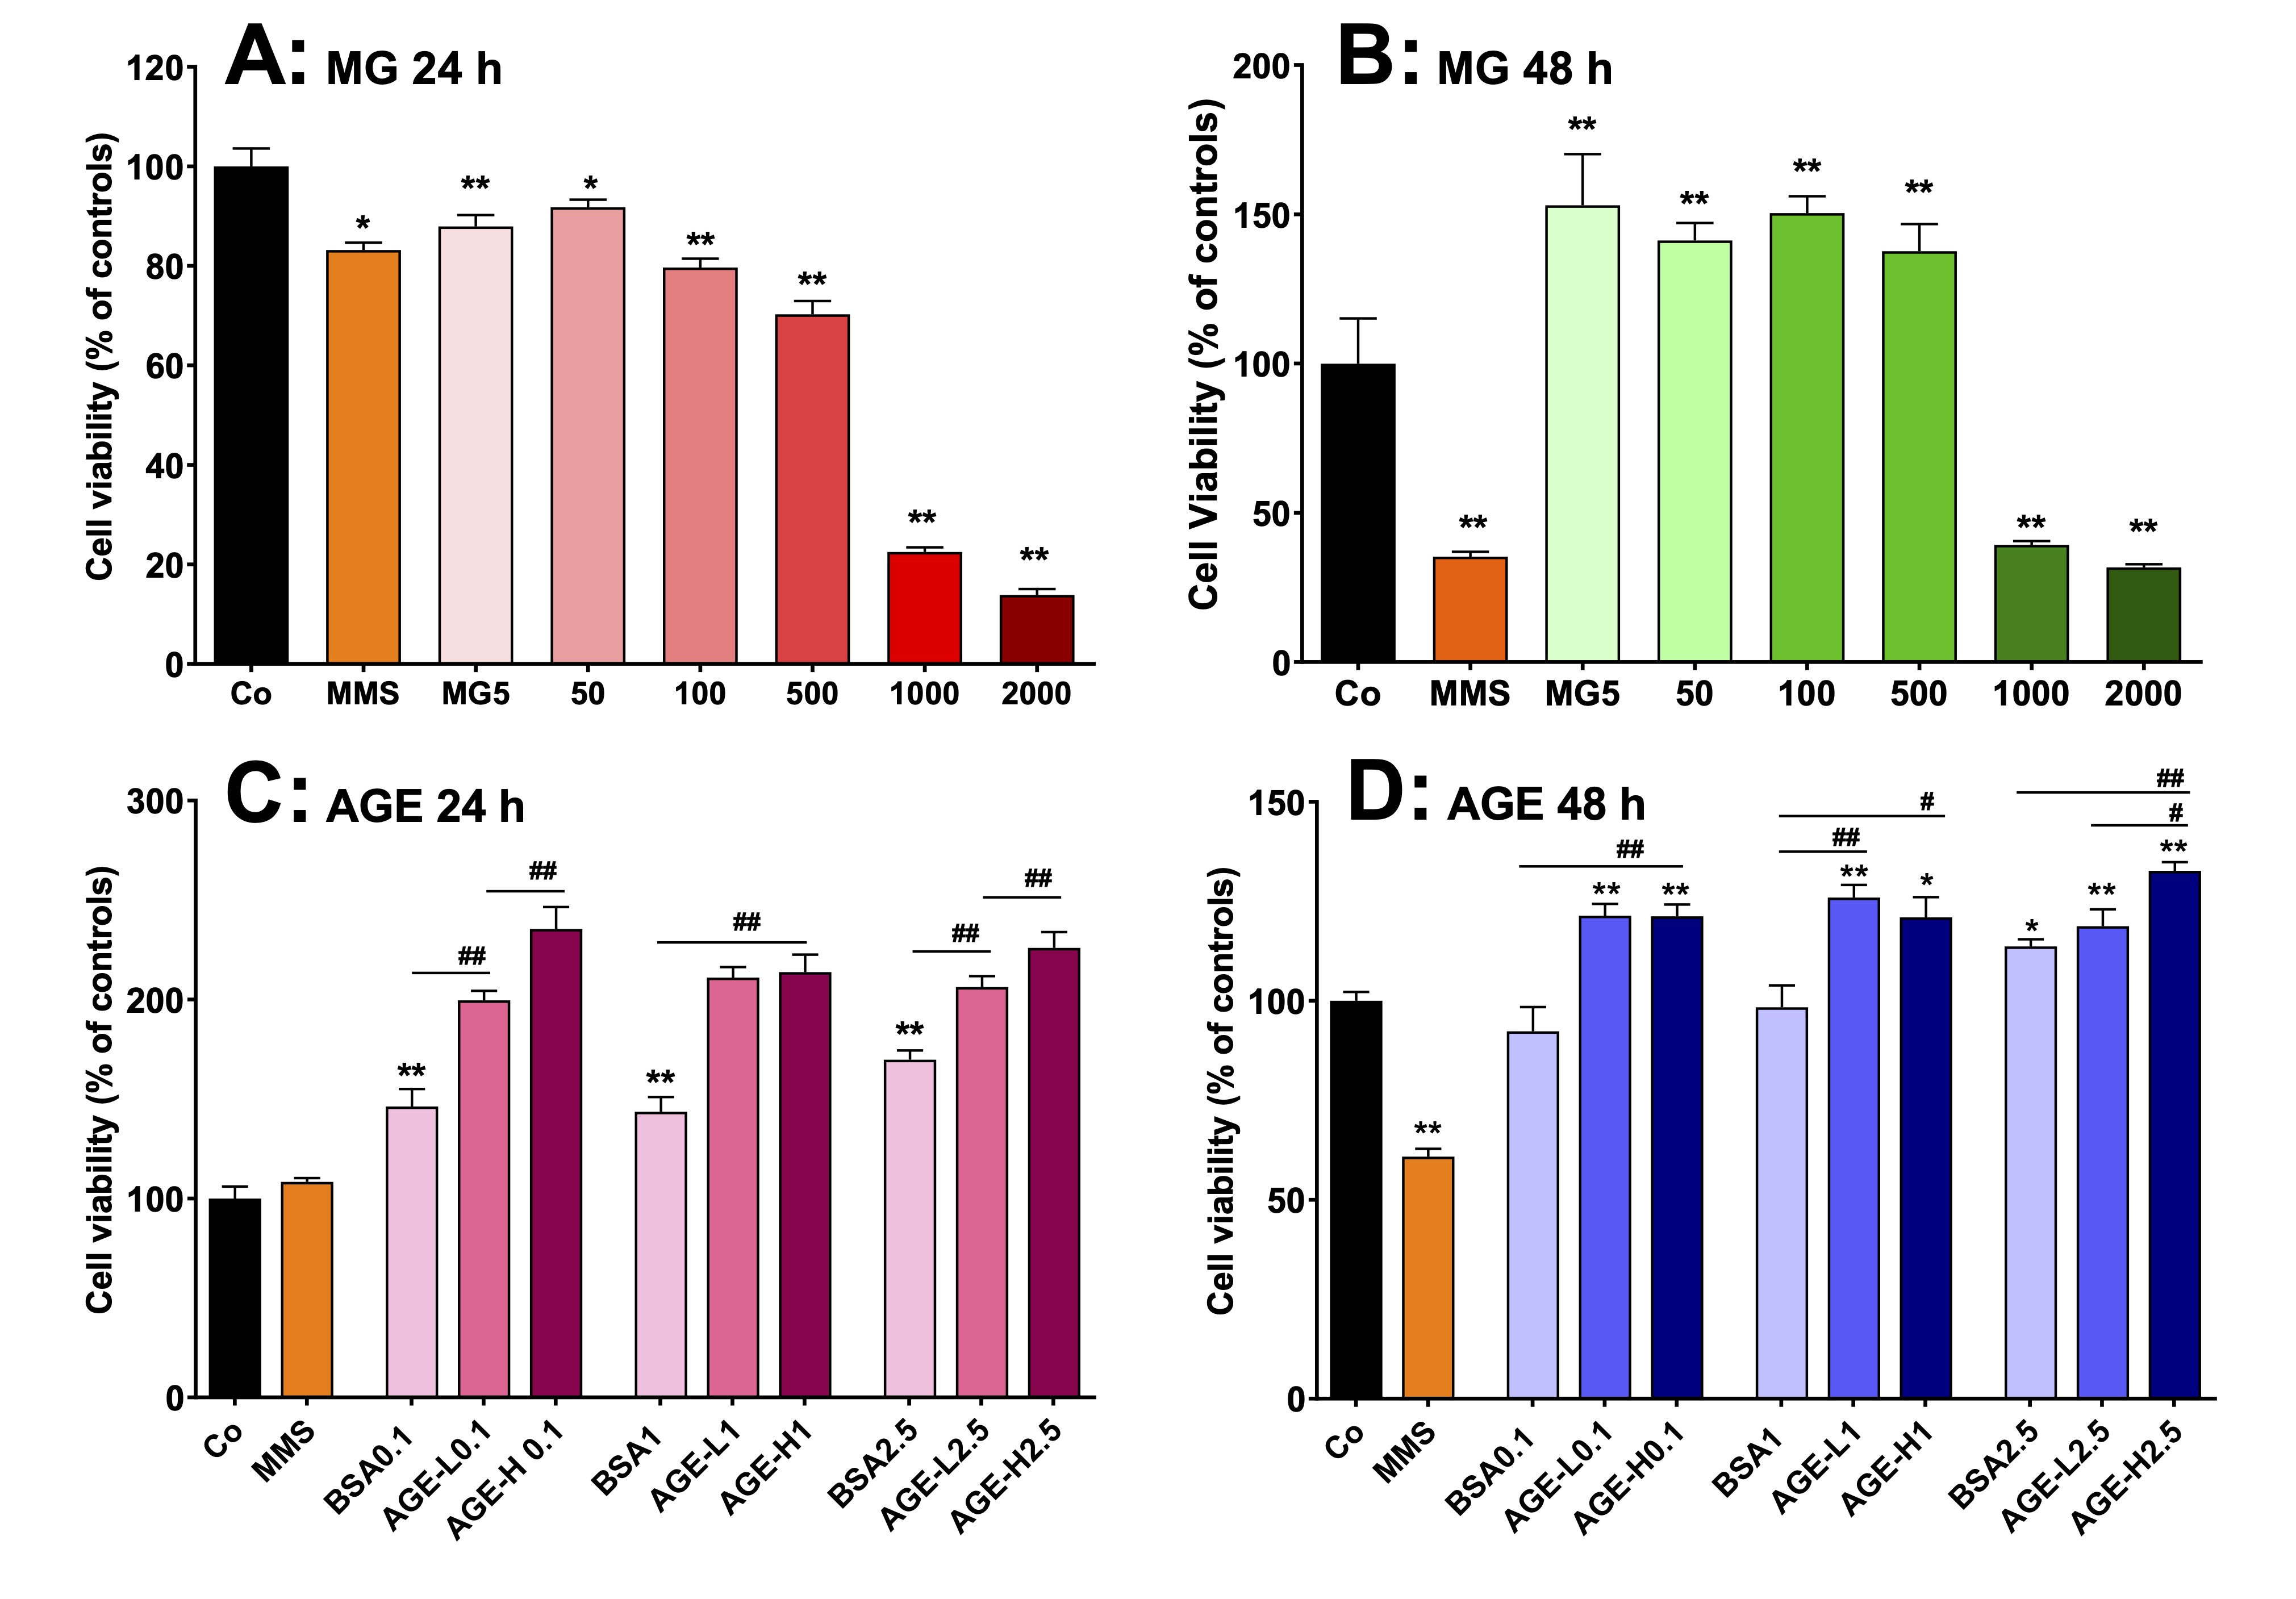
Fig. 13: Effects of MG and AGE on cell viability of human peripheral lymphocytes in vitro. AGEs were produced by incubating bovine serum albumin (BSA) with 50 mM (AGE-L) or 250 mM (AGE-H) MG. Lymphocytes were obtained from human peripheral blood from four healthy male donors and cells were cultured at 37 °C in 96-well plates containing RPMI medium supplemented with FBS. The lymphocytes viability was evaluated by the MTT method. A and B: cell viability of lymphocytes that were incubated with MG at concentrations in the range of 5-2000 µM during 24 h and 48 h, respectively. C and D: cell viability of lymphocytes that were incubated with AGE at concentrations of 0.1, 1 and 2.5 mg/mL during 24 h and 48 h, respectively. MMS (methyl methanesulfonate) was employed as positive control. Values are the mean ± SEM of 4 experiments. *p<0.01 and **p<0.001: different from Co. #p<0.01 and ##p<0.001: difference indicated by the supper lines (―).
Discussion
General aspects
In
general terms it is apparent from the results of the present work
that MG administered to healthy rats causes
systemic inflammation and metabolic changes similar to diseases
associated with a widespread catabolism in
the body: reduction of food intake, loss
of lean mass, increase of lipolysis and
lower body weight gain.
MG also influences the metabolism in adipose tissues and liver in
several ways. The most important events are illustrated by Fig. 14,
which utilizes the data of this work to represent in a schematic way
the integrated metabolic modifications occurring in adipose tissues
and liver of rats that received MG. These events will be discussed in
the following paragraphs.
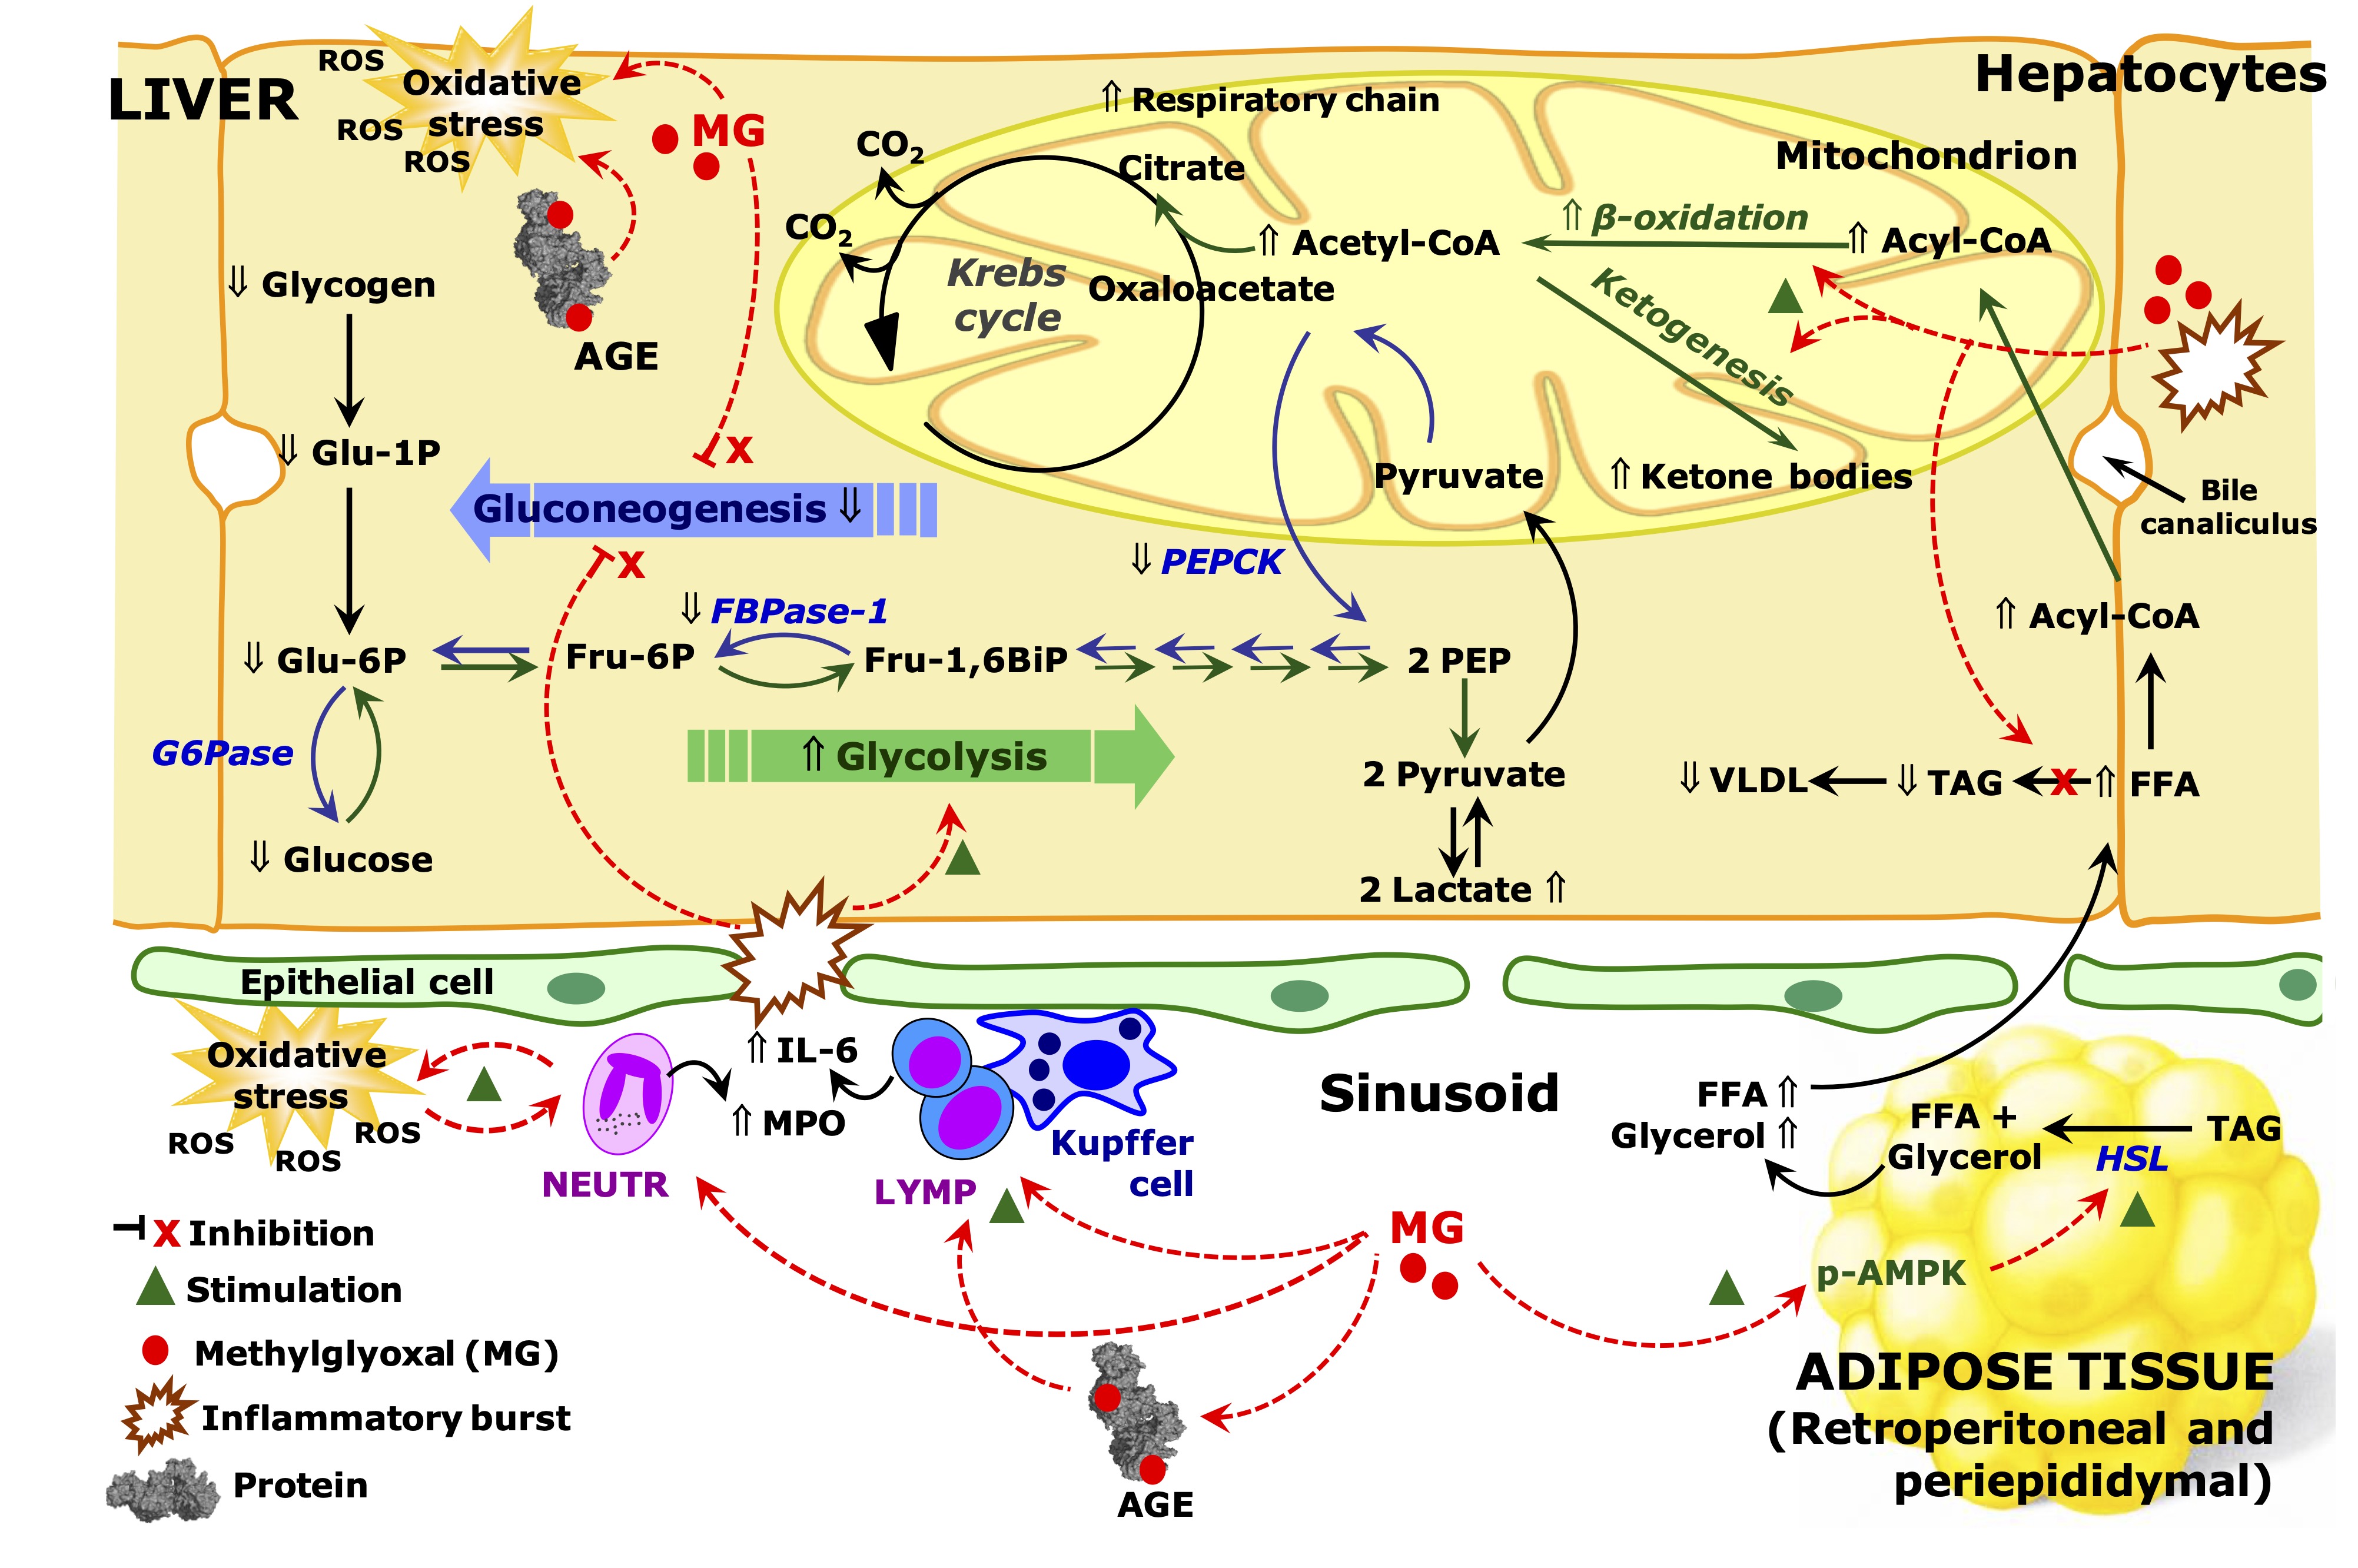
Fig. 14: Schematic representation of the effects of MG on inflammation and metabolic pathways in the liver and adipose tissue of rats. The scheme is discussed in the text and is based on the results of the current work. The symbol Ý means up-regulation and ß down-regulation. Red arrows indicate effects of methylglyoxal (MG). Abbreviations: MPO, myeloperoxidase; IL-6, interleukin 6; FFA, free fat acids; TAG, triglycerides; VLDL, very low density lipoprotein; HSL, hormone sensible lipase; AGE, advanced glycation end products; PEP, phosphoenolpyruvate; Glu-6-P, glucose 6-phosphate; Fru-6-P, fructose 6-phosphate; Fur-1,6-BiP, fructose 1,6-bisphosphate; G6Pase, glucose 6-phosphatase; PEPCK, phosphoenolpyruvate carboxykinase; FBPase-1, phosphofructokinase 1; CoA, coenzyme A; ROS, reactive oxygen species; LYMP, lymphocytes, NEUTR, neutrophils.
Inflammation and oxidative status
The
administration of MG for seven days increased its levels in the
plasma for 2-4 times and in the liver by approximately 2 times,
similar to those observed in patients with cirrhosis and diabetes,
and rats with CCl4-induced
hepatitis [17, 59, 60]. These high levels of MG increased the hepatic
and serum levels of AGE and caused systemic inflammation in healthy
rats. CML
and MG-H1 are the main adducts (AGE) formed by the reaction of MG
with proteins and they were increased in the liver. This shows that
proteins, including enzymes, are being structurally modified by MG
and, by consequence, they can be functionally impaired. The reduced
GLO-I mRNA expression must be contributing to elevate even more the
levels of AGE in the liver. In fact, the higher production of MG in
diabetes and obesity has been related with the downregulation of
GLO-I [3, 61].
Increases
in MPO activity in the plasma and liver correspond, respectively, to
leukocytosis and infiltration of inflammatory cells in the organ,
which was followed by increases of IL-6 expression. Together,
inflammation and AGE are likely to be acting synergistically to
upregulate the RAGE expression, which should increase even more liver
inflammation. In the present study, both MG and AGE were able to
increase lymphocyte viability in
vitro.
This agrees with observations that MG promotes macrophage activation
and lymphocyte proliferation, and that AGE-RAGE interaction induces
lymphocyte proliferation [62, 63]. Furthermore, the activation of
inflammatory cells by MG leads to the production of cytokines,
particularly IL-6, which induces NF-κB activation, RAGE expression
and severe cirrhosis [17].
In
addition, the reduced expression of SIRT1 in the liver of rats that
received MG can further exacerbate these effects, as this enzyme
inhibits NF-κB and decreases hepatic fibrosis [64].
Advanced
liver diseases, such as cirrhosis, are normally associated with liver
damage. However, not always systemic inflammation is accompanied by
liver injury [55]. Plasma markers of liver damage were only slightly
increased in rats that received MG, more specifically, only the AST
activity was somewhat increased, a finding that indicates moderate
liver damage [54, 55]. However, this phenomenon is the same occurring
in patients with advanced cirrhosis, in which only a moderate
elevation of AST activity is associated with impaired liver function,
reduced albumin levels and high levels of circulating MG and IL-6
[17]. The levels of albumin and the ratio of albumin/globulin were
reduced in the liver of rats that received MG, however, both systemic
inflammation and liver damage are associated with these changes. It
is therefore possible that MG causes a high-grade systemic
inflammation with mild liver damage.
MG
led to increases in the levels of ROS and protein carbonyl groups, a
pro-oxidative marker, in the liver. The plasma levels of protein
carbonyl groups were also increased and the antioxidant capacity was
reduced. This increased oxidative stress is probably the result of
both systemic inflammation and direct action of MG on proteins. In
fact, carbonylation of proteins occurs by the reaction with ROS and
also when MG reacts with amino and sulfhydryl groups [3,
32] (Fig.
S1 in Supplementary Materials). It is worth to emphasize that the
sulfhydryl groups (thiols) of albumin account for 70% of the
antioxidant capacity of the plasma [32]. In the liver, GSH is an
intracellular antioxidant and it is also used to detoxify MG in the
reaction of GLO-I and II. The hepatic GLO-I expression was reduced,
and GSH levels were unaffected. However, the GSH/GSSG ratio was
decreased in the liver due to an increase in GSSG levels, which is
indicative of oxidative stress. The GSSG accounts for less than 10%
of the total glutathione (GSH plus GSSG) in the healthy liver [55],
but it seems, at least in part, that there is an impairment in GSH
regeneration. The expression of GR and GPx1 was not altered,
indicating that this impairment may be due to either a reduction in
the activity of these enzymes caused by direct action of MG or a
limitation in the availability of the electron donor NADPH.
Anyway,
GSH levels were not altered, indicating that its availability does
not seem to be the cause of hepatic oxidative stress. As
a further indication of the impairment of the hepatic antioxidant
defenses is the observation that catalase and SOD, which contribute
to scavange ROS, were both reduced by the MG treatment [55, 65]. In
addition, SIRT1, whose hepatic expression was inhibited by MG, is
reported to upregulate the expression of SOD and catalase [66].
Hepatic
HO-1 expression was increased by MG, which may have both pro- and
antioxidant effects. Its expression is, in fact, elevated in
steatohepatitis as an adaptive response to oxidative stress [67].
Lipid metabolism and ketogenesis
In the
present study, MG
did not modify the total lipid content in the liver and even
decreased the hepatic content of TAG. This suggests that the
administration of MG did not result in hepatic steatosis but in
increased catabolism linked to high-grade inflammation and cirrhosis
[15, 20].
Rats that received MG present lower body weight gain without
diminishing the total fat mass, i.e., there is loss of lean
mass [22, 24]. The reason for the lower body weight gain is
not solely anorexia, but metabolic alterations due to systemic
inflammation are also partly responsible [68, 69]. Corroborating this
conclusion is our observation that rats that received MG at a lower
dose (25 mg/kg) had a lower weight gain without reduction of food
intake.
MG did
not change the total fat mass of rats, but it modified the pattern of
body visceral fat depots. In the mesenteric tissue, the fat mass and
the area of adipocytes increased while the opposite occurred in the
periepididymal and retroperitoneal tissues. It is true that the fat
mass of young rats (~60 days old) is still very low (~3% of body
weight) when compared to adult rats [70] and there is no certainty
that this modified distribution will be maintained along the entire
life period. On the other hand, the
expression and activation of the AMPK protein is consistent
phenomenon. The AMPK protein, known to
stimulate lipolysis in adipose tissue, had its expression reduced in
the mesenteric tissue while both expression and activation (p-AMPK)
were increased in the retroperitoneal
adipose tissue of fasted rats that received MG. In fact, the
retroperitoneal fat depot has higher
capacity to release fatty acids compared to the mesenteric fat depot
and AMPK can be differently regulated in different tissues, being
even able to stimulate or inhibit lipolysis in adipose tissue [71,
72]. The higher levels of glycerol found in plasma of fasted rats
that received MG corroborate a stimulated lipolysis in the adipose
tissue, particularly in the retroperitoneal fat tissue, and also
indicate higher circulating levels of free fatty acids (FFA). This
should cause an increased influx of FFA to the liver. The breakdown
of FFA into ketone bodies and the palmitate-dependent extra oxygen
uptake were increased in the livers of rats that received MG, two
observations that are consistent with the hypothesis. It is also
worth to mention that systemic inflammation is associated with a
higher hepatic FFA uptake and oxidation [20].
The
levels of TAG and ketone bodies were decreased in the plasma of
fasted rats that received MG. The lower levels of hepatic and
circulating TAG in these rats may have resulted from the increased
FAA oxidation in the liver. Lower hepatic lipogenesis, an omnipresent
event in advanced cirrhosis and high-grade systemic inflammation [20,
73], may also have contributed to the phenomenon. At this point it is
important to note that the higher rate of ketogenesis described here
for livers from fasted rats that received MG are in apparent
contradiction to the lower levels of circulating ketone bodies found
under this condition. However, this phenomenon has been reported for
rats with high-grade systemic inflammation and there is evidence
indicating that it occurs as a consequence of an increased uptake by
peripheral tissues [20]. Ketone bodies are eagerly absorbed in the
peripheral tissues by the monocarboxylate transporter 1 (MCT1), which
is present in virtually every cell and is upregulated by cytokines in
skeletal muscle [74, 75].
Rats
that received MG presented a strongly modified glucose tolerance
curve and insulin resistance. On this respect it has been claimed
that the administration of MG to rats causes glucose intolerance,
decreases the insulin-stimulated glucose uptake in adipose tissue and
promotes pancreatic dysfunction [23]. In addition, insulin resistance
is also an important hallmark in advanced cirrhosis [76]. However,
rats that received MG presented lower fasting
glycemia. This is a somewhat surprising result if one takes into
account that insulin resistance is generally associated with high
levels of blood glucose. The phenomenon is possibly the consequence
of an excessive catabolism linked to the high-grade systemic
inflammation and lower release of hepatic glucose. The latter can be
the result of lower hepatic glycogen content associated with to lower
gluconeogenesis in the rats that received MG.
Gluconeogenesis and glycolysis
The
metabolic fluxes of carbohydrates in the liver were also modified by
MG in a way that anabolic processes were diminished and catabolic
fluxes were increased. In relation to anabolic process, MG inhibited
gluconeogenesis from two precursors, namely lactate and glycerol. Two
events seem to contribute to the phenomenon: a deficient energy
supply from mitochondrial oxidative phosphorylation and a
downregulation of gluconeogenic key enzymes. The reports on the
effects of MG on the respiratory activity of isolated hepatic
mitochondria show inconsistencies, as
mitochondrial dysfunction and no alterations have been reported
[77-79]. In the present study, isolated mitochondria were indeed
affected by MG; specifically, the MMP was lower, and oxygen uptake
was accelerated when succinate was the precursor. This shows an
increased activity of the respiratory chain, more precisely a slight
uncoupling action, but without pronounced reductions in
ATP production. Thus, a deficient mitochondrial energy supply cannot
be the main responsible for the impaired gluconeogenesis. In fact,
glucose production from glycerol and lactate were equally impaired
and glycerol gluconeogenesis needs only a third of the energy
required for lactate gluconeogenesis.
With
respect to the rate-limiting enzymes, MG
decreased the activity and mRNA expression of both PEPCK and
FBPase-1, and the activity of G6Pase. These are certainly key
determinants in reducing hepatic gluconeogenesis. It has been shown
that pro-inflammatory cytokines inhibit PEPCK expression in the liver
and AGE are reported to increase the expression of the carbohydrate
responsive element-binding protein (ChREBP), which decreases the
expression of PEPCK in hepatic cells [80, 81]. In addition,
pro-inflammatory cytokines and IL-1
have been shown to diminish hepatic alanine gluconeogenesis in
healthy rats [82] and IL-6 has been shown
to inhibit gluconeogenesis in the liver of healthy mice and to
downregulate the expression of gluconeogenic key enzymes in the liver
of mice with NASH and hepatocarcinogenesis [83, 84]. In turn, protein
levels and phosphorylation of AMPK, known
to downregulate gluconeogenesis, was not
modified in the liver of rats that received MG [72]. In this regard,
AMPK has been reported not to be required for the downregulation of
hepatic gluconeogenesis and, in addition, pro-inflammatory cytokines
diminish AMPK expression and activation in the liver [72, 85].
The
higher hepatic expression of G6Pase mRNA in rats that received MG is
an apparently contradictory result if one considers that the activity
of this enzyme was reduced. Because G6Pase is not covalently
regulated, its activity,
when measured under standard conditions, reflects
its active protein level in the microsomal fraction. An explanation
for the apparent discrepancy would be a negative post-transcriptional
regulation of the protein expression, a dysfunctional enzyme or even
an enzyme maintained in compartments to which glucose 6-phosphate has
no access (regulation by translocation) [86]. In this regard, FFA and
fatty acyl-CoA increase G6Pase mRNA in the rat liver [87], however,
the G6Pase expression is reported to be regulated also at the
post-transcriptional level, with the protein
being structurally modified by MG [88]. Gluconeogenesis in the
present study, however, was inferred from metabolic fluxes measured
in perfused livers, a system that maintains the
fine regulation in terms of substrate concentrations and allosteric
effectors [40].
The perfused liver provides, no doubt, a more reliable system to
infer about the actual metabolic fluxes in the liver than mRNA
expression or enzyme activities [40].
In
relation to catabolic processes, the MG administration increased the
glycerol flux through glycolysis in perfused livers from fasted rats,
as indicated by the increased lactate production, but it did not
modify oxygen consumption. The latter observation means that little
pyruvate, which is formed by the lactate dehydrogenase equilibrium,
is oxidized intramitochondrially. This could be indicating some
degree of impairment of the mitochondrial functions that justifies
the increased lactate production and the lowered glucose production.
Increased lactate production by MG was also observed in HepG2 cells,
an effect that was accompanied by increased glucose uptake and
enhanced expression of glycolytic enzymes [89]. The latter also
occurs in high-grade systemic inflammation and advanced cirrhosis
[90] possibly due to the fact that IL-6 upregulates glycolytic
enzymes in the liver [91]. In livers from fed rats, on the contrary,
glycolysis at the expense of endogenous glycogen was diminished by
the MG. This was probably the consequence of diminished glycogen
levels caused by the high-grade systemic inflammation [68, 92].
Conclusion
The administration of MG to healthy rats during seven days causes high-grade systemic inflammation and mild liver damage. The metabolic changes are similar to diseases associated with a widespread catabolism in the body, particularly advanced hepatic cirrhosis: reduction of food intake, loss of lean mass, lower body weight gain and increased systemic oxidative stress. In addition, MG causes insulin resistance, however, associated with a lower fasting glycemia, which is a consequence of both an excessive catabolism and lower release of hepatic glucose. Metabolic fluxes in the liver were modified by MG in a way that anabolic processes, such as gluconeogenesis and glycogenesis were diminished, and catabolic fluxes, such as glycolysis, were increased in the organ. Two factors can contribute to this outcome, though in unequal proportions: a mild deficiency in energy supply from the mitochondria and a much more significant downregulation of gluconeogenic key enzymes. Lipid metabolism in the adipose tissue was modified in a way that AMPK-stimulated lipolysis was increased in the retroperitoneal fat depot, but not in the mesenteric fat depot. In addition, ketogenesis was increased and the content of TAG was decreased in the liver. To what degree the modifications in hepatic energy metabolism found in MG-exposed rats can be translated to patients with a high-grade inflammation and cirrhosis is uncertain. However, it is unlikely that the strong catabolic state induced by MG would not contribute in some way to the hepatic dysfunction in advanced liver diseases.
Abbreviations:
AFU,
arbitrary fluorescence units; AGE,
advanced glycation end products; ALT,
alanine aminotransferase; AMPK,
AMP-activated protein kinase; p-AMPK, phosphorylated AMPK; AST,
aspartate aminotransferase; AUC, area under
the curve; BSA, bovine serum albumin; CML, carboxymethyl
lysine; CHOL, cholesterol; DMSO, dimethyl
sulfoxide; FBPase-1, fructose 1,
6-biphosphatase; FFA, free fatty acids; FRAP,
ferric reduction capacity of plasma; G6Pase,
glucose 6-phosphatase; GADPH,
glyceraldehyde-3-phosphate dehydrogenase;
GPDH, glycerol-3-phosphate dehydrogenase;
GK, glycerol kinase; GLO-I, glyoxalase I;
GLO-II, glyoxalase II; GR, glutathione reductase; GPx1, glutathione
peroxidase-1; GSH, reduced glutathione;
GSSG, oxidized glutathione; GSTA3,
glutathione S-transferase alpha 3; HO-1, heme oxigenase 1;
IL-1, interleukin 1; IL-6, interleukin 6;
ITT, insulin tolerance test; kITT, rate constant for insulin
tolerance test; MG, methylglyoxal; MG-H1,
methylglyoxal-derived hydroimidazolone 1;
MMP, mitochondrial membrane potential; MMS, methanesulfonate;
MPO, myeloperoxidase;
MTT, 3-(4, 5-dimethylthiazol-2-yl)-2, 5-diphenyl tetrazolium bromide;
NAFLD, non-alcoholic fatty liver disease; NASH, nonalcoholic
steatohepatitis; NF-κB, nuclear factor-kappa B; OGTT,
oral glucose tolerance test; PBS, phosphate-buffered saline; PEPCK,
phosphoenolpyruvate carboxykinase; RAGE,
AGE receptor; RC, respiratory
control; ROS, reactive oxygen species;
SIRT1, sirtuin 1; SOD, superoxide
dismutase; TAC, total antioxidant capacity;
TAG, triacylglycerol; TNF-α,
tumoral necrosis factor alpha.
Acknowledgements
The authors wish to thank the financial support of the Coordenação de Aperfeiçoamento de Pessoal de Nível Superior (CAPES) and Conselho Nacional de Desenvolvimento Científico e Tecnológico (CNPq) Grants 404589/2023-5 and 312464/2020-7. Naiara Cristina Lucredi thanks the funding by CAPES (process-88881.624409/2021-01) for the national financial support and incentive to research. The authors are grateful to the Mayo Clinics and Foundation (Florida, EUA) for financial support through the Helen Diller Family Foundation, the Glenn Foundation for Medical Research via the Paul F. Glenn Laboratories for the Biology of Aging, Calico Life Sciences LLC, National Institute on Aging Grants AG-26094 and AG58812, and National Cancer Institute Grant CA233790.
Disclosure Statement
The authors have no conflicts of interest to declare.
References
| 1 | Brings S, Fleming T, Freichel M, Muckenthaler M, Herzig S, Nawroth P: Dicarbonyls and advanced glycation end-products in the development of diabetic complications and targets for intervention. Int J Mol Sci 2017;18:984.
https://doi.org/10.3390/ijms18050984 |
| 2 | Kalapos MP: Where does plasma methylglyoxal originate from? Diabetes Res Clin Pract 2013;99:260-271.
https://doi.org/10.1016/j.diabres.2012.11.003 |
| 3 | Rabbani N, Thornalley PJ: The critical role of methylglyoxal and glyoxalase 1 in diabetic nephropathy. Diabetes 2014;63:50-52.
https://doi.org/10.2337/db13-1606 |
| 4 | Schalkwijk CG, Stehouwer CDA: Methylglyoxal, a highly reactive dicarbonyl compound, in diabetes, its vascular complications, and other age-related diseases. Physiol Rev 2020;100:407-461.
https://doi.org/10.1152/physrev.00001.2019 |
| 5 | Thornalley PJ: The glyoxalase system: new developments towards functional characterization of a metabolic pathway fundamental to biological life. Biochem J 1990;269:1-11.
https://doi.org/10.1042/bj2690001 |
| 6 | Matafome P, Rodrigues T, Sena C, Seiça R: Methylglyoxal in metabolic disorders: facts, myths, and promises. Med Res Rev 2016;37:368-403.
https://doi.org/10.1002/med.21410 |
| 7 | Tanaka N, Yonekura H, Yamagishi S, Fujimori H, Yamamoto Y, Yamamoto H: The receptor for advanced glycation end products is induced by the glycation products themselves and tumor necrosis factor-alpha through nuclear factor-kappa B, and by 17-beta-estradiol through Sp-1 in human vascular endothelial cells. J Biol Chem 2000;275:25781-25790.
https://doi.org/10.1074/jbc.M001235200 |
| 8 | Guilbaud A, Niquet-Leridon C, Boulanger E, Tessier F: How can diet affect the accumulation of advanced glycation end-products in the human body? Foods 2016;5:84.
https://doi.org/10.3390/foods5040084 |
| 9 | Smedsrød B, Melkko J, Araki N, Sano H, Horiuchi S: Advanced glycation end products are eliminated by scavenger-receptor-mediated endocytosis in hepatic sinusoidal Kupffer and endothelial cells. Biochem J 1997;322:567-573.
https://doi.org/10.1042/bj3220567 |
| 10 | Neves C, Rodrigues T, Sereno J, Simões C, Castelhano J, Gonçalves J, Bento G, Gonçalves S, Seiça R, Domingues MR, Castelo-Branco M, Matafome P: Dietary glycotoxins impair hepatic lipidemic profile in diet-induced obese rats causing hepatic oxidative stress and insulin resistance. Oxid Med Cell Longev 2019;2019:6362910.
https://doi.org/10.1155/2019/6362910 |
| 11 | Bijnen M, van Greevenbroek MMJ, van der Kallen CJH, Scheijen JL, van der Waarenburg MPH, Stehouwer CDA, Wouters K, Schalkwijk CG: Hepatic fat content and liver enzymes are associated with circulating free and protein-bound advanced glycation end products, which are associated with low-grade inflammation: The CODAM study. J Diabetes Res 2019;2019:6289831.
https://doi.org/10.1155/2019/6289831 |
| 12 | Yang M, Fan J, Zhang J, Du J, Peng X: Visualization of methylglyoxal in living cells and diabetic mice model with a 1, 8-naphthalimide-based two-photon fluorescent probe. Chem Sci 2018;9:6758-6764.
https://doi.org/10.1039/C8SC02578A |
| 13 | Wang W-C, Chou C-K, Chuang M-C, Li Y-C, Lee J-A: Elevated levels of liver methylglyoxal and d-lactate in early-stage hepatitis in rats. Biomed Chromatogr 2017;32:e4039.
https://doi.org/10.1002/bmc.4039 |
| 14 | Reddy JK, Rao MS: Lipid metabolism and liver inflammation. II. Fatty liver disease and fatty acid oxidation. Am J Physiol Gastrointest Liver Physiol 2006;290:G852-G858.
https://doi.org/10.1152/ajpgi.00521.2005 |
| 15 | Arakawa Y, Moriyama M, Arakawa Y: Liver cirrhosis and metabolism (sugar, protein, fat and trace elements). Hepatol Res 2004;30S:46-58.
https://doi.org/10.1016/j.hepres.2004.10.009 |
| 16 | Schauder P: Catabolism in patients with liver cirrhosis; in: Müller MJ, Danforth E, Burger AG, Siedentopp U (eds): Hormones and Nutrition in Obesity and Cachexia. Springer, Berlin, Heidelberg, 1990, pp 95-103.
https://doi.org/10.1007/978-3-642-75037-3_10 |
| 17 | Michel M, Hess C, Kaps L. Kremer WM, Hilscher M, Galle PR, Moehler M, Schattenberg JM, Wörns MA, Labenz C, Nagel M: Elevated serum levels of methylglyoxal are associated with impaired liver function in patients with liver cirrhosis. Sci Rep 2021;11:20506.
https://doi.org/10.1038/s41598-021-00119-7 |
| 18 | Arroyo V, Angeli P, Moreau R, Jalan R, Clària J, Trebicka J, Fernández J, Gustot T, Caraceni P, Bernardi M: The systemic inflammation hypothesis: Towards a new paradigm of acute decompensation and multiorgan failure in cirrhosis. J Hepatol 2021;74:670-685.
https://doi.org/10.1016/j.jhep.2020.11.048 |
| 19 | Engelmann C, Clària J, Szabo G, Bosch J, Bernardi M: Pathophysiology of decompensated cirrhosis: Portal hypertension, circulatory dysfunction, inflammation, metabolism and mitochondrial dysfunction. J Hepatol 2021;75:S49-S66.
https://doi.org/10.1016/j.jhep.2021.01.002 |
| 20 | Wendt MMN, de Oliveira MC, Franco-Salla GB, Castro LS, Parizotto AV, Souza-Silva FM, Natali MRM, Bersani-Amado CA, Bracht A, Comar JF: Fatty acids uptake and oxidation are increased in the liver of rats with adjuvant-induced arthritis. Biochim Biophys Acta Mol Basis Dis 2019;1865:696-707.
https://doi.org/10.1016/j.bbadis.2018.12.019 |
| 21 | Van Wyngene L, Vandewalle J, Libert C: Reprogramming of basic metabolic pathways in microbial sepsis: therapeutic targets at last? EMBO Mol Med 2018;10:e8712.
https://doi.org/10.15252/emmm.201708712 |
| 22 | Sena CM, Matafome P, Crisóstomo J, Rodrigues L, Fernandes R, Pereira P, Seiça RM: Methylglyoxal promotes oxidative stress and endothelial dysfunction. Pharmacol Res 2012;65:497-506.
https://doi.org/10.1016/j.phrs.2012.03.004 |
| 23 | Dhar A, Desai KM, Wu L: Alagebrium attenuates acute methylglyoxal-induced glucose intolerance in Sprague-Dawley rats. Br J Pharmacol 2010;159:166-175.
https://doi.org/10.1111/j.1476-5381.2009.00469.x |
| 24 | Yang SE, Lin YF, Liao JW, Chen JT, Chen CL, Chen CI, Hsu SL, Song TY: Insulin sensitizer and antihyperlipidemic effects of Cajanus cajan (L.) millsp. root in methylglyoxal-induced diabetic rats. Chin J Physiol 2022;65:125-135.
https://doi.org/10.4103/cjp.cjp_88_21 |
| 25 | Ghosh M, Talukdar D, Ghosh S, Bhattacharyya N, Ray M, Ray S: In vivo assessment of toxicity and pharmacokinetics of methylglyoxal. Augmentation of the curative effect of methylglyoxal on cancer-bearing mice by ascorbic acid and creatine. Toxicol Appl Pharmacol 2006;212:45-58.
https://doi.org/10.1016/j.taap.2005.07.003 |
| 26 | Cat AND, Briones AM: Isolation of mature adipocytes from white adipose tissue and gene expression studies by real-time quantitative RT-PCR. Methods Mol Biol 2017;1527:283-295.
https://doi.org/10.1007/978-1-4939-6625-7_22 |
| 27 | Bradley PP, Christensen RD, Rothstein G: Cellular and extracellular myeloperoxidase in pyogenic inflammation. Blood 1982;60:618-622.
https://doi.org/10.1182/blood.V60.3.618.618 |
| 28 | Davidson MB, Karjala R: Simplified fluorometric method for the determination of plasma glycerol. J Lipid Res 1970;11:609-612.
https://doi.org/10.1016/S0022-2275(20)42946-3 |
| 29 | Bergmeyer HU: Methods of Enzymatic Analysis, London: Verlag Chemie-Academic Press, 1974. ISBN: 352725370X, 9783527253708
|
| 30 | Lobo Jr JP, Brescansin CP, Santos-Weiss ICR, Welter M, Souza EM, Rego FGM, Picheth G, Alberton D: Serum fluorescent advanced glycation end (F-AGE) products in gestational diabetes patients. Arch Endocrinol Metab 2017;61:233-237.
https://doi.org/10.1590/2359-3997000000238 |
| 31 | Benzie IF, Strain JJ: The ferric reducing ability of plasma (FRAP) as a measure of "antioxidant power": the FRAP assay. Anal Biochem 1996;239:70-76.
https://doi.org/10.1006/abio.1996.0292 |
| 32 | Bracht A, Silveira SS, Castro-Ghizoni CV, Sá-Nakanishi AB, Oliveira MRN, Bersani-Amado CA, Peralta RM, Comar JF: Oxidative changes in the blood and serum albumin differentiate rats with monoarthritis and polyarthritis. SpringerPlus 2016;5:36-50.
https://doi.org/10.1186/s40064-016-1671-1 |
| 33 | Levine RL, Garland D, Oliver CN, Amici A, Climent I, Lenz AG, Ahn BW, Shaltiel S, Stadtman ER: Determination of carbonyl content in oxidatively modified proteins. Methods Enzymol 1990;186:464-478.
https://doi.org/10.1016/0076-6879(90)86141-H |
| 34 | Hissin PJ, Hilf R: Fluorimetric method for determination of oxidized and reduced glutathione in tissues. Analyt Biochem 1976;74:214-226.
https://doi.org/10.1016/0003-2697(76)90326-2 |
| 35 | Biazon ACB, Wendt MMN, Moreira JR, Castro-Ghizoni CV, Soares AA, Silveira SS, Sa-Nakanishi AB, Bersani-Amado CA, Peralta RM, Bracht A, Comar JF: The in vitro antioxidant capacities of hydroalcoholic extracts from roots and leaves of Smallanthus sonchifolius (yacon) do not correlate with their in vivo antioxidant action in diabetic rats. J Biosci Med 2016;4:15-27.
https://doi.org/10.4236/jbm.2016.42003 |
| 36 | Marklund S, Marklund G: Involvement of the superoxide anion radical in the oxidation of pyrogallol and a convenient assay for superoxide dismutase. Eur J Biochem 1974;47:469-474.
https://doi.org/10.1111/j.1432-1033.1974.tb03714.x |
| 37 | Comar JF, Suzuki-Kemmelmeier F, Bracht A: The action of oxybutinin on haemodynamics and metabolism in the perfused rat liver. Basic Clin Pharmacol Toxicol 2003;93:147-152.
https://doi.org/10.1034/j.1600-0773.2003.930307.x |
| 38 | Simões M, Ames-Sibin AP, Lima EP, Pateis VO, Bersani-Amado CA, Mathias PCF, Peralta RM, Sá-Nakanishi AB, Bracht L, Bracht A, Comar JF: Resveratrol biotransformation and actions on the liver metabolism of healthy and arthritic rats. Life Sci 2022;310:120991.
https://doi.org/10.1016/j.lfs.2022.120991 |
| 39 | Oliveira AL, Comar JF, de Sá-Nakanishi AB, Peralta RM, Bracht A: The action of p-synephrine on hepatic carbohydrate metabolism and respiration occurs via both Ca(2+)-mobilization and cAMP production. Mol Cell Biochem 2014;388:135-147.
https://doi.org/10.1007/s11010-013-1905-2 |
| 40 | Sá-Nakanishi AB, de Oliveira MC, Pateis VO, Silva LAP, Pereira-Maróstica HV, Gonçalves GA, Oliveira MAS, Godinho J, Bracht L, Milani H, Bracht A, Comar JF: Glycemic homeostasis and hepatic metabolism are modified in rats with global cerebral ischemia. Biochim Biophys Acta Mol Basis Dis 2020;1866:165934.
https://doi.org/10.1016/j.bbadis.2020.165934 |
| 41 | Lima LC, Buss GD, Ishii-Iwamoto EL, Salgueiro-Pagadigorria CL, Comar JF, Bracht A, Constantin J: Metabolic effects of p-coumaric acid in the perfused rat liver. J Biochem Mol Toxicol 2006;20:18-26.
https://doi.org/10.1002/jbt.20114 |
| 42 | Vilela VR, Oliveira AL, Comar JF, Peralta RM, Bracht A: Effects of tadalafil on the cAMP stimulated glucose output in the rat liver. Chem Biol Interact 2014;220:1-11.
https://doi.org/10.1016/j.cbi.2014.05.020 |
| 43 | Souza KS, Moreira LS, Silva BT, Oliveira BPM, Carvalho AS, Silva PS, Verri WA Jr, Sá-Nakanishi AB, Bracht L, Zanoni JN, Gonçalves OH, Bracht A, Comar JF: Low dose of quercetin-loaded pectin/casein microparticles reduces the oxidative stress in arthritic rats. Life Sci 2021;284:119910.
https://doi.org/10.1016/j.lfs.2021.119910 |
| 44 | Sá-Nakanishi AB, Soni-Neto J, Moreira LS, Gonçalves GA, Silva-Comar FMS, Bracht L, Bersani-Amado CA, Peralta RM, Bracht A, Comar JF: Anti-inflammatory and antioxidant actions of methyl jasmonate are associated with metabolic modifications in the liver of arthritic rats. Oxid Med Cell Longev 2018;2018:2056250.
https://doi.org/10.1155/2018/2056250 |
| 45 | Sá-Nakanishi AB, Soares AA, de Oliveira AL, Comar JF, Peralta RM, Bracht A: Effects of treating old rats with an aqueous Agaricus blazei extract on oxidative and functional parameters of the brain tissue and brain mitochondria. Oxid Med Cell Longev 2014;2014:563179.
https://doi.org/10.1155/2014/563179 |
| 46 | Lowry OH, Rosebrough NJ, Farr AL, Randall RJ: Protein measurement with the Folin phenol reagent. J Biol Chem 1951;193:265-275.
https://doi.org/10.1016/S0021-9258(19)52451-6 |
| 47 | Mendonça DEA, Godoy MAF, Lucredi NC, Comar JF, Almeida IV, Vicentini VEP: Toxicogenic effects of the mushroom Ganoderma lucidum on human liver and kidney tumor cells and peripheral blood lymphocytes. J Ethnopharmacol 2023;307:116226.
https://doi.org/10.1016/j.jep.2023.116226 |
| 48 | Remor AP, de Matos FJ, Ghisoni K, da Silva TL, Eidt G, Búrigo M, de Bem AF, Silveira PC, de León A, Sanchez MC, Hohl A, Glaser V, Gonçalves CA, Quincozes-Santos A, Borba Rosa R, Latini A: Differential effects of insulin on peripheral diabetes-related changes in mitochondrial bioenergetics: involvement of advanced glycosylated end products. Biochim Biophys Acta 2011;1812:1460-1471.
https://doi.org/10.1016/j.bbadis.2011.06.017 |
| 49 | Mosmann T: Rapid colorimetric assay for cellular growth and survival: application to proliferation and cytotoxicity assays. J Immunol Methods 1983;65:55-63.
https://doi.org/10.1016/0022-1759(83)90303-4 |
| 50 | Mukherjee S, Das S, Bedi M, Vadupu L, Ball WB, Ghosh A: Methylglyoxal-mediated Gpd1 activation restores the mitochondrial defects in a yeast model of mitochondrial DNA depletion syndrome. Biochim Biophys Acta Gen Subj 2023;1867:130328.
https://doi.org/10.1016/j.bbagen.2023.130328 |
| 51 | Comar JF, de Oliveira DS, Bracht L, Kemmelmeier FS, Peralta RM, Bracht A: The Metabolic responses to l-glutamine of livers from rats with diabetes types 1 and 2. PLoS One 2016;11:e0160067.
https://doi.org/10.1371/journal.pone.0160067 |
| 52 | Viollet B, Foretz M, Guigas B, Horman S, Dentin R, Bertrand L, Hue L, Andreelli F: Activation of AMP-activated protein kinase in the liver: a new strategy for the management of metabolic hepatic disorders. J Physiol 2006;574:41-53.
https://doi.org/10.1113/jphysiol.2006.108506 |
| 53 | Patel R, Baker SS, Liu W, Desai S, Alkhouri R, Kozielski R, Mastrandrea L, Sarfraz A, Cai W, Vlassara H, Patel MS, Baker RD, Zhu L: Effect of dietary advanced glycation end products on mouse liver. PloS One 2012;7:e35143.
https://doi.org/10.1371/journal.pone.0035143 |
| 54 | Pratt DS, Kaplan MM: Evaluation of abnormal liver-enzyme results in asymptomatic patients. N Engl J Med 2000;342:1266-1271.
https://doi.org/10.1056/NEJM200004273421707 |
| 55 | Comar JF, Sá-Nakanishi AB, de Oliveira AL, Wendt MMN, Bersani-Amado CA, Ishii-Iwamoto EL, Peralta RM, Bracht A: Oxidative state of the liver of rats with adjuvant-induced arthritis. Free Rad Biol Med 2013;58:144-53.
https://doi.org/10.1016/j.freeradbiomed.2012.12.003 |
| 56 | Moreira LS, Chagas AC, Ames-Sibin AP, Pateis VO, Gonçalves OH, Silva-Comar FMS, Hernandes L, Sá-Nakanishi AB, Bracht L, Bersani-Amado CA, Bracht A, Comar JF: Alpha-tocopherol-loaded polycaprolactone nanoparticles improve the inflammation and systemic oxidative stress of arthritic rats. J Tradit Complement Med 2021;12:414-425.
https://doi.org/10.1016/j.jtcme.2021.12.003 |
| 57 | Wendt MM, Sá-Nakanishi AB, Castro-Ghizoni CV, Bersani-Amado CA, Peralta RM, Bracht A, Comar JF: Oxidative state and oxidative metabolism in the brain of rats with adjuvant-induced arthritis. Exp Mol Pathol 2015;98:549-57.
https://doi.org/10.1016/j.yexmp.2015.04.002 |
| 58 | Schubert AC, Wendt MM, Sá-Nakanishi AB, Bersani-Amado CA, Peralta RM, Comar JF, Bracht A: Oxidative state and oxidative metabolism of the heart from rats with adjuvant-induced arthritis. Exp Mol Pathol 2016;100:393-401.
https://doi.org/10.1016/j.yexmp.2016.03.005 |
| 59 | Kong X, Ma MZ, Huang K, Qin L, Zhang HM, Yang Z, Li XY, Su Q: Increased plasma levels of the methylglyoxal in patients with newly diagnosed type 2 diabetes 2. J Diabetes 2014;6:535-540.
https://doi.org/10.1111/1753-0407.12160 |
| 60 | Wang WC, Chou CK, Chuang MC, Li YC, Lee JA: Elevated levels of liver methylglyoxal and d-lactate in early-stage hepatitis in rats. Biomed Chromatogr 2018;32:10.1002/bmc.4039.
https://doi.org/10.1002/bmc.4039 |
| 61 | Rabbani N, Thornalley PJ: Glyoxalase 1 Modulation in Obesity and Diabetes. Antioxid Redox Signal 2019;30:354-374.
https://doi.org/10.1089/ars.2017.7424 |
| 62 | Bhattacharyya N, Pal A, Patra S, Haldar AK, Roy S, Ray M: Activation of macrophages and lymphocytes by methylglyoxal against tumor cells in the host. Int Immunopharmacol 2008;8:1503-1512.
https://doi.org/10.1016/j.intimp.2008.06.005 |
| 63 | Ramasamy R, Vannucci SJ, Yan SS, Herold K, Yan SF, Schmidt AM: Advanced glycation end products and RAGE: a common thread in aging, diabetes, neurodegeneration, and inflammation. Glycobiology 2005;15:16R-28R.
https://doi.org/10.1093/glycob/cwi053 |
| 64 | Zhao W, Xu W, Jiang H: Relevance of SIRT1-NF-κB axis as therapeutic target to ameliorate inflammation in liver disease. Int J Mol Sci 2020;21:9460.
https://doi.org/10.3390/ijms21249460 |
| 65 | Choudhary D, Chandra D, Kale RK: Influence of methylglyoxal on antioxidant enzymes and oxidative damage. Toxicol Lett 1997;93:141-152.
https://doi.org/10.1016/S0378-4274(97)00087-8 |
| 66 | Alqrad MAI, El-Agamy DS, Ibrahim SRM, Sirwi A, Abdallah HM, Abdel-Sattar E, El-Halawany AM, Elsaed WM, Mohamed GA: SIRT1/Nrf2/NF-κB signaling mediates anti-inflammatory and anti-apoptotic activities of oleanolic acid in a mouse model of acute hepatorenal damage. Medicina (Kaunas, Lithuania) 2023;59:1351.
https://doi.org/10.3390/medicina59071351 |
| 67 | Malaguarnera L, Madeddu R, Palio E, Arena N, Malaguarnera M: Heme oxygenase-1 levels and oxidative stress-related parameters in non-alcoholic fatty liver disease patients. J Hepatol 2005;42:585-591.
https://doi.org/10.1016/j.jhep.2004.11.040 |
| 68 | Muscaritoli M, Imbimbo G, Jager-Wittenaar H, Cederholm T, Rothenberg E, di Girolamo FG, Amabile MI, Sealy M, Schneider S, Barazzoni R, Biolo G, Molfino A: Disease-related malnutrition with inflammation and cachexia. Clin Nutr 2023;42:1475-1479.
https://doi.org/10.1016/j.clnu.2023.05.013 |
| 69 | Martín AI, Castillero E, Granado M, López-Menduiña M, Villanúa MA, López-Calderón A: Adipose tissue loss in adjuvant arthritis is associated with a decrease in lipogenesis, but not with an increase in lipolysis. J Endocrinol 2008;197:111-119.
https://doi.org/10.1677/JOE-07-0491 |
| 70 | DiGirolamo M, Fine JB, Tagra K, Rossmanith R: Qualitative regional differences in adipose tissue growth and cellularity in male Wistar rats fed ad libitum. Am J Physiol 1998;274:R1460-467.
https://doi.org/10.1152/ajpregu.1998.274.5.R1460 |
| 71 | Palou M, Sánchez J, Priego T, Rodríguez AM, Picó C, Palou A: Regional differences in the expression of genes involved in lipid metabolism in adipose tissue in response to short- and medium-term fasting and refeeding. J Nutr Biochem 2010;21:23-33.
https://doi.org/10.1016/j.jnutbio.2008.10.001 |
| 72 | Jeon SM: Regulation and function of AMPK in physiology and diseases. Exp Mol Med 2016;48:e245.
https://doi.org/10.1038/emm.2016.81 |
| 73 | Privitera G, Spadaro L, Marchisello S, Fede G, Purrello F: Abnormalities of lipoprotein levels in liver cirrhosis: Clinical relevance. Dig Dis Sci 2018;63:16-26.
https://doi.org/10.1007/s10620-017-4862-x |
| 74 | Benton CR, Yoshida Y, Lally J, Han XX, Hatta H, Bonen A: PGC-1alpha increases skeletal muscle lactate uptake by increasing the expression of MCT1 but not MCT2 or MCT4. Physiol Genomics 2008;35:45-54.
https://doi.org/10.1152/physiolgenomics.90217.2008 |
| 75 | Puigserver P, Rhee J, Lin J, Wu Z, Yoon JC, Zhang CY, Krauss S, Mootha VK, Lowell BB, Spiegelman BM: Cytokine stimulation of energy expenditure through p38 MAP kinase activation of PPARγ coactivator-1. Mol Cell 2001;8:971-982.
https://doi.org/10.1016/S1097-2765(01)00390-2 |
| 76 | Dietrich CG, Götze O, Geier A: Molecular changes in hepatic metabolism and transport in cirrhosis and their functional importance. World J Gastroenterol 2016;22:72-88.
https://doi.org/10.3748/wjg.v22.i1.72 |
| 77 | Seo K, Ki SH, Shin SM: Methylglyoxal induces mitochondrial dysfunction and cell death in liver. Toxicol Res 2014;30:193-198.
https://doi.org/10.5487/TR.2014.30.3.193 |
| 78 | Prestes AS, Dos Santos MM, Kamdem JP, Mancini G, Schüler da Silva LC, Bem AF, Barbosa NV: Methylglyoxal disrupts the functionality of rat liver mitochondria. Chem Biol Interact 2022;351:109677.
https://doi.org/10.1016/j.cbi.2021.109677 |
| 79 | Ghosh A, Bera S, Ghosal S, Ray S, Basu A, Ray M: Differential inhibition/inactivation of mitochondrial complex I implicates its alteration in malignant cells. Biochemistry (Mosc) 2011;76:1051-1060.
https://doi.org/10.1134/S0006297911090100 |
| 80 | Feingold KR, Moser A, Shigenaga JK, Grunfeld C: Inflammation inhibits the expression of phosphoenolpyruvate carboxykinase in liver and adipose tissue. Innate Immun 2012;18:231-240.
https://doi.org/10.1177/1753425911398678 |
| 81 | Chen H, Li Y, Zhu Y, Wu L, Meng J, Lin N, Yang D, Li M, Ding W, Tong X, Su Q: Advanced glycation end products promote ChREBP expression and cell proliferation in liver cancer cells by increasing reactive oxygen species. Medicine (Baltimore) 2017;96:e7456.
https://doi.org/10.1097/MD.0000000000007456 |
| 82 | Kelmer-Bracht AM, Broetto-Biazon AC, de Sá-Nakanishi AB, Ishii-Iwamoto EL, Bracht A: Low doses of tumour necrosis factor alpha and interleukin 1beta diminish hepatic gluconeogenesis from alanine in vivo. Basic Clin Pharmacol Toxicol 2006;99:335-339.
https://doi.org/10.1111/j.1742-7843.2006.pto_496.x |
| 83 | Wang B, Hsu SH, Frankel W, Ghoshal K, Jacob ST: Stat3-mediated activation of microRNA-23a suppresses gluconeogenesis in hepatocellular carcinoma by down-regulating glucose-6-phosphatase and peroxisome proliferator-activated receptor gamma, coactivator 1 alpha. Hepatology 2012;56:186-197.
https://doi.org/10.1002/hep.25632 |
| 84 | Inoue H, Ogawa W, Ozaki M, Haga S, Matsumoto M, Furukawa K, Hashimoto N, Kido Y, Mori T, Sakaue H, Teshigawara K, Jin S, Iguchi H, Hiramatsu R, LeRoith D, Takeda K, Akira S, Kasuga M: Role of STAT-3 in regulation of hepatic gluconeogenic genes and carbohydrate metabolism in vivo. Nat Med 2004;10:168-174.
https://doi.org/10.1038/nm980 |
| 85 | Johanns M, Hue L, Rider MH: AMPK inhibits liver gluconeogenesis: fact or fiction? Biochem J 2023;480:105-125.
https://doi.org/10.1042/BCJ20220582 |
| 86 | Stanton RC: Glucose-6-phosphate dehydrogenase, NADPH, and cell survival. IUBMB Life 2012;64:362-369.
https://doi.org/10.1002/iub.1017 |
| 87 | Van Schaftingen E, Gerin I: The glucose-6-phosphatase system. Biochem J 2002;362:513-532.
https://doi.org/10.1042/0264-6021:3620513 |
| 88 | Massillon D: Regulation of the glucose-6-phosphatase gene by glucose occurs by transcriptional and post-transcriptional mechanisms. Differential effect of glucose and xylitol. J Biol Chem 2001;276:4055-4062.
https://doi.org/10.1074/jbc.M007939200 |
| 89 | Sruthi CR, Raghu KG: Methylglyoxal induces ambience for cancer promotion in HepG2 cells via Warburg effect and promotes glycation. J Cell Biochem 2022;123:1532-1543.
https://doi.org/10.1002/jcb.30215 |
| 90 | Li J, Wang T, Xia J, Yao W, Huang F: Enzymatic and nonenzymatic protein acetylations control glycolysis process in liver diseases. FASEB J 2019;33:11640-11654.
https://doi.org/10.1096/fj.201901175R |
| 91 | Soto-Heredero G, Gómez de Las Heras MM, Gabandé-Rodríguez E, Oller J, Mittelbrunn M: Glycolysis - a key player in the inflammatory response. FEBS J 2020;287:3350-3369.
https://doi.org/10.1111/febs.15327 |
| 92 | Castro-Ghizoni CV, Ames APA, Lameira OA, Bersani-Amado CA, Sá-Nakanishi AB, Bracht L, Marçal-Natali MR, Peralta RM, Bracht A, Comar JF: Anti-inflammatory and antioxidant actions of copaiba oil are related to liver cell modifications in arthritic rats. J Cell Biochem 2017;118:3409-3423.
https://doi.org/10.1002/jcb.25998 |
| 93 | Habeeb AF: Determination of free amino groups in proteins by trinitrobenzenesulfonic acid. Anal Biochem 1966;14:328-336.
https://doi.org/10.1016/0003-2697(66)90275-2 |