Original Article - DOI:10.33594/000000728
Accepted 28 August 2024 - Published online 15 September 2024
GNAS, not a Highly Mutated Gene, Has Prognostic Significance and Carcinogenic Effects in Osteosarcoma
bHuman Anatomy Experimental Training Center, School of Basic Medicine Science, Wannan Medical College, Wuhu 241001, Anhui Province, China,
cShanghai Jiao Tong University Affiliated Sixth People's Hospital South Campus, Shanghai 201400, China
Keywords
Abstract
Background/Aims:
Osteosarcoma is a prevalent and aggressive primary malignant bone tumor affecting children and adolescents. Despite advancements in sequencing technologies, there remains a lack of reliable prognostic biomarkers and effective targeted therapies for osteosarcoma. This study focuses on identifying key prognostic genes, particularly the role of GNAS, in osteosarcoma progression.Methods:
Bioinformatics analyses were performed on osteosarcoma datasets from the Gene Expression Omnibus (GEO). Differential gene expression analysis, weighted correlation network analysis (WGCNA), and survival analysis identified potential prognostic hub genes. The expression and function of these genes were validated through immunohistochemistry and animal experiments. Specifically, the role of GNAS was investigated through siRNA-mediated knockdown in osteosarcoma cell lines and nude mice models.Results:
Five hub genes (PROP1, GNAS, CYP4F2, LHX3, CNGB1) were identified as significantly related to osteosarcoma prognosis. Among these, GNAS was found to be highly expressed in osteosarcoma tissues compared to normal tissues. Immunohistochemical analysis confirmed the elevated expression of GNAS in osteosarcoma samples. GNAS mutation analysis revealed a low mutation rate in osteosarcoma, suggesting its oncogenic role is independent of mutational status. Animal experiments demonstrated that knocking down GNAS significantly inhibited tumor growth and induced apoptosis in osteosarcoma cells.Conclusion:
GNAS is highly expressed in osteosarcoma and associated with poor prognosis, acting as an oncogene in osteosarcoma progression. Targeting GNAS could be a potential therapeutic strategy for osteosarcoma. Further studies on GNAS-related signaling pathways may provide deeper insights into the molecular mechanisms driving osteosarcoma malignancy.Introduction
Osteosarcoma is the most common primary malignant tumor of bone, and metastasis and recurrence are the main causes of poor prognosis [1]. Osteosarcoma tends to occur in children and adolescents [2]. With the continuous development and improvement of second-generation sequencing technology, sequencing the entire genome, whole exome, or targeted genes of tumor tissue can provide comprehensive molecular information for the diagnosis, treatment, and prognosis of tumors [3]. However, there is currently no clear biomarker for predicting the clinical prognosis of osteosarcoma. Further research on the molecular mechanisms of osteosarcoma, seeking new molecular markers and therapeutic targets, is crucial for improving clinical outcomes and patient prognosis.
GNAS is located on chromosome 20 and has a high complex printing expression pattern that can encode the alpha-subunit of the stimulatory heterotrimeric G protein (Gs-alpha) [4]. Gs-alpha is a key element in the classic signal transduction pathway that connects receptor ligand interactions and multiple cellular receptors. Gs-alpha can stimulate adenylate cyclase to promote the conversion of adenosine triphosphate (ATP) to cyclic adenosine monophosphate (cAMP), thereby exerting biological effects in regulating cell growth and division [5]. Gs-alpha can regulate bone cell differentiation and maturation through signaling pathways such as Hedgehog and Wnt/catenin, playing a crucial role in bone development and homeostasis [6, 7].
In addition, studies have found that mutations in GNAS are mainly located in the 8th exon of Gs-alpha, where the coding gene for the 201st amino acid undergoes a G → A or C → T missense mutation, causing the arginine in the 201st amino acid position of Gs-alpha to be replaced by histidine or cysteine [8, 9]. GNAS mutations can lead to fibrous dysplasia/McCune Albright Syndrome, pseudohyperparathyroidism type1-B, multiple bone fiber malnutrition, progressive bone dysplasia, multiple bone fiber dysplasia, and other bone diseases [10-12]. More importantly, GNAS mutations are regarded as gsp activated oncogenes [13, 14]. However, it is currently unclear whether GNAS play the role of oncogenes in osteosarcoma, whether they are highly expressed in osteosarcoma cells.
Recently, GNAS mutations have been detected in a significant proportion of patients with para-osteosarcoma [8]. Due to the small number of reported cases in this study, we began to question the specificity of GNAS mutations in osteosarcoma. A recent study did not find GNAS mutations in 90 cases of low-grade osteosarcoma [15]. In view of this, we conducted a GNAS mutation study on 7494 cases of soft tissue and bone sarcoma using bioinformatics methods, and analyzed the specific mutation forms of GNAS in bone and soft tissue sarcoma.
In this study, we investigated the expression of GNAS and its mutations in osteosarcoma to clarify the mutation rate of GNAS in the progression of osteosarcoma, and analyzed the correlation between GNAS and clinical prognosis of osteosarcoma patients, providing a new theoretical basis for searching for new biomarker of osteosarcoma.
Materials and Methods
Materials and Cells
The 143B cell line was purchased from iCell Bioscience Inc, Shanghai, and BALB/c-nu mice (8 weeks old, 18-22g) were purchased from Sipeifu (Suzhou) Biotechnology Co., Ltd. 143B cells were cultured in DMEM medium containing 10% fetal bovine serum (FBS), penicillin (100U/ml) and streptomycin (100 lg/ml) at 37 ℃ in humidified air with 5% CO2.
Data collection
Gene Expression Omnibus (GEO) datasets were selected based on the following inclusion criteria: (1) The dataset is an osteosarcoma dataset; (2) There is clear clinical information (such as survival time and status) to ensure the quality and reliability of the study; (3) The number of cases is greater than 10 or more; (4) Gene IDs in the dataset can be converted into standard gene symbols. Finally, the GSE33382, GSE39055, GSE16088, and GSE16091 datasets were selected for data analysis in this study. Use R software inSilicoMerging package to merge the datasets [16]. The expression matrix of the merged dataset is shown in Supplementary Fig. 1A, the data expression density is shown in Supplementary Fig. 1B, and the data distribution is shown in Supplementary Figures 1C-D. Further remove batch effects from the merged dataset to obtain the gene expression matrix after removing batch effects. And batch effects were removed from the dataset, using the R software package Stats (version 3.6.0) for Principal Component Analysis (PCA) to obtain the final dataset data to be analyzed [17]. Fig. 1 illustrates the process of enrollment and subsequence study.
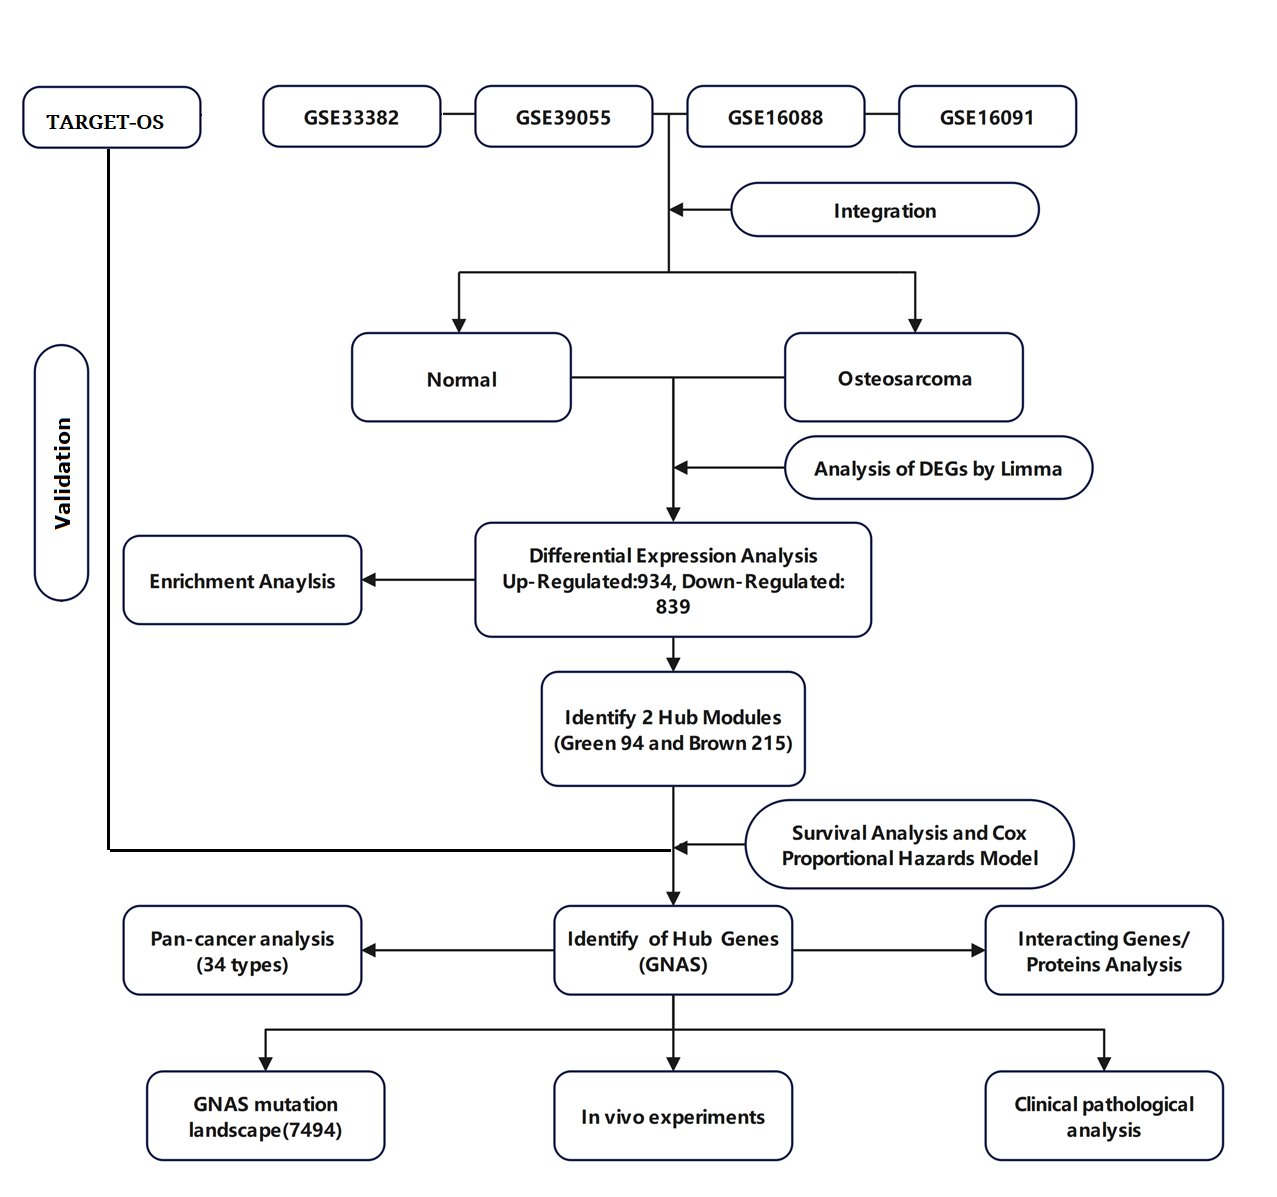
Fig. 1: The flowchart of this study.
Differential gene analysis
The R software Limma package is a differential expression screening method based on a generalized linear model [18]. Here, we use the R software package limma (version 3.40.6) for differential analysis to obtain differentially expressed genes between the tumor group and the normal group. We select differentially expressed genes with | log2FC |>1.5 (fold change, FC) and P<0.05 for subsequent analysis.
Differential gene enrichment analysis
GO annotation was performed on upregulated and downregulated differentially expressed genes using R software package org.Hs.eg.db (version 3.1.0), and KEGG pathway enrichment analysis was performed using R software package clusterProfiler (version 3.14.3) [19]. P value of<0.05 and False Discovery Rate (FDR) < 0.1 were considered statistically significant
Identification of prognostic related mRNA modules and genes in osteosarcoma
Weighted correlation network analysis (WGCNA) is a systems biology method used to describe gene association patterns between different samples [20]. This study used the R software "WGCNA" function package to preprocess differentially expressed genes, and used the "goodsamplegenes()" function to check for abnormal genes in the data and select the optimal threshold β ( β was a soft thresholding parameter was used to construct a scale-free network) for 4 (Supplementary Figure2A,B). Load clinical feature data and draw gene feature heatiness clustering diagram to complete the construction of co expression network and module selection. Identify prognostic related mRNA modules for osteosarcoma. Draw a scatter plot of the correlation between gene significance (GS) and module membership (MM) in the prognostic module to clarify the significance of Hub genes within the module. GS and MM are highly correlated, illustrating that genes are highly significantly associated with a trait that is also the most important (central) elements of modules associated with the trait [21].
Analysis of protein-protein interactions encoded by differentially genes
Importing Significantly Differentially Expressed Hub Genes into String Database (https://string-db.org/) to obtain the source file, and input the obtained source file into Cytoscape software (version 3.6.1) for visual analysis, and screen the interaction relationships of core hub genes based on their maximum clique centrality (MCC) ranking, as well as the protein-protein interaction relationships of hub genes related to the prognosis of osteosarcoma.
Survival Analysis and COX Analysis
Using R software package Survival, survival time, survival status, and gene expression data were integrated, and the prognostic significance of each Hub gene was evaluated using a multivariate COX proportional regression risk model. The Kaplan Meier curve displays the overall survival difference between high and low gene expression, with P<0.05 indicating a statistically significant difference.
Mutation landscape analysis
We used MutationMapper tool to depict the mutation landscape of GNAS. We also use CBioPortal to access and analyze date (http://www.cbioportal.org/).
Pan cancer analysis
We downloaded the standardized pan cancer dataset TCGA TARGET GTEx (PANCAN, N=19131, G=60499) from UCSC database (https://xenabrowser.net/), and further extracted the expression data of ENSG00000087460 (GNAS) gene in various samples. We further screened samples from normal solid tissue, primary solid tumor, primary blood derived cancer, bone marrow, primary blood derived cancer, peripheral blood, and We performed a log2 (x+0.001) transformation on each expression value, and finally excluded cancer specifications with less than 3 samples in a single cancer specification Finally, we obtained expression data for 34 cancer specifications, as shown in the Supplementary File 1.
Immunohistochemistry
Immunohistochemical analysis for determining the expression of Gs-alpha in osteosarcoma tissue: paraffin tissue slices of patients were used as a primary antibody negative control with phosphate solution. Distinguish high or low levels of Gs-alpha based on positive cell rate and staining intensity. Negative and weakly positive indicate low expression, while positive and strongly positive indicate high expression.
Animal model
Inoculate 143B cells at a concentration of 2 × 10 ^ 6 cells per 200 μL into 18 BALB/c-nu mice. After inoculation, observe and measure the tumor size daily, and randomly divide them into three groups after successful tumor modeling (tumor volume 80-100mm3). Administer twice a week, dosage and protocol: (a) PBS alone; (b) Mixed with NC siRNA (50nmol); (c) Mixed with GNAS siRNA (50nmol). Measure the length and width of mice tumor every 3 days using a caliper to evaluate tumor growth. Tumor volumes were calculated by the modified ellipsoidal formula: V=1/2 (length * width) [22]. After the last dose, fast for 12 hours and euthanize to obtain tumor tissue (tumor tissues were harvested), weigh the weight of each mice tumor, calculate the tumor growth inhibition value (TGI value), and take photos of the tumors in each group of mice. TGI = (1- (treatment group tumor volume change rate/control group tumor volume change rate) * 100%) [23].
Reverse Transcription Polymerase Chain Reaction (RT-PCR)
RT-PCR was mentioned in previous studies [24]. Briefly, the RNA extraction kit extracts total RNA from tumor tissue, with GAPDH as the internal reference. A reaction system and conditions are established according to the instructions of the kit. RNA is reverse transcribed into cDNA, which is then used as a template for real-time quantitative amplification in an RT-PCR instrument. The relative expression level of GNAS mRNA in the corresponding sample is calculated using the 2^(-△△CT) method. Primer sequences were as follows: GNAS (F 5 'TGG AGA GGA GAA GGA GAG AAG 3', R 5 'GCA GGA GGA GGA GGA GGA 3')
Western Blot (WB)
Use RIPA lysis solution containing a mixture of protease inhibitors to lyse tissues. Determine protein content using the BCA protein assay kit. Separate 30 through 8% SDS-PAGE μ Transfer the protein to the polyvinylidene fluoride (PVDF) membrane. Seal the membrane with 5% skim milk for 1 hour, and then incubate it overnight with the primary antibody at 4 ℃. The first antibody includes GNAS and GAPDH, both diluted at a ratio of 1:1000. After washing, the membrane was incubated with horseradish peroxidase labeled secondary antibody at room temperature for 1 hour, and then developed using an ECL detection kit.
Pathological Staining
Conventional fixation, dehydration, embedding, and slicing. Hematoxylin Eosin (HE) staining: Tissue sections were stained with Harris hematoxylin and 0.5% eosin, respectively. Observe the morphological changes of tissue cells in different groups. TUNEL staining: Using DAPI cell nucleus staining solution to stain cell tissue sections of different groups, and observing the morphological characteristics of apoptosis in different groups under a fluorescence microscope.
Statistical methods
Statistical analysis was conducted using SPSS 21 software and GraphPad Prism software (10.0 version); Compare the inter group differences of econometric data through one-way analysis of variance (ANOVA) or t-test; P<0.05 indicates that the difference is statistically significant.
Results
Identification of Differentially Expressed Genes (DEGs)
The gene expression matrix of the dataset after removing batch effects is shown in Fig. 2A, B. PCA excluded outlier sample data (3 tumor samples and 6 normal samples). Finally, 166 samples of osteosarcoma tissue and 6 normal tissue samples were obtained (Fig. 2C). The detailed information of the dataset is shown in Table 1. Differential gene expression analysis was performed on the dataset data to obtain 1773 differentially expressed genes in normal tissue samples and osteosarcoma samples, of which 934 genes were upregulated, including UBE3A, ITGB1, SLC25A24, SEC24B, RNF139. 839 genes were downregulated, including CIDEC, FOXH1, CASR, HRG, GEMIN7, FCRL2 (Fig. 2D). The heat map shows the top 30 significantly differentially expressed genes with high and low expression (Fig. 2E).
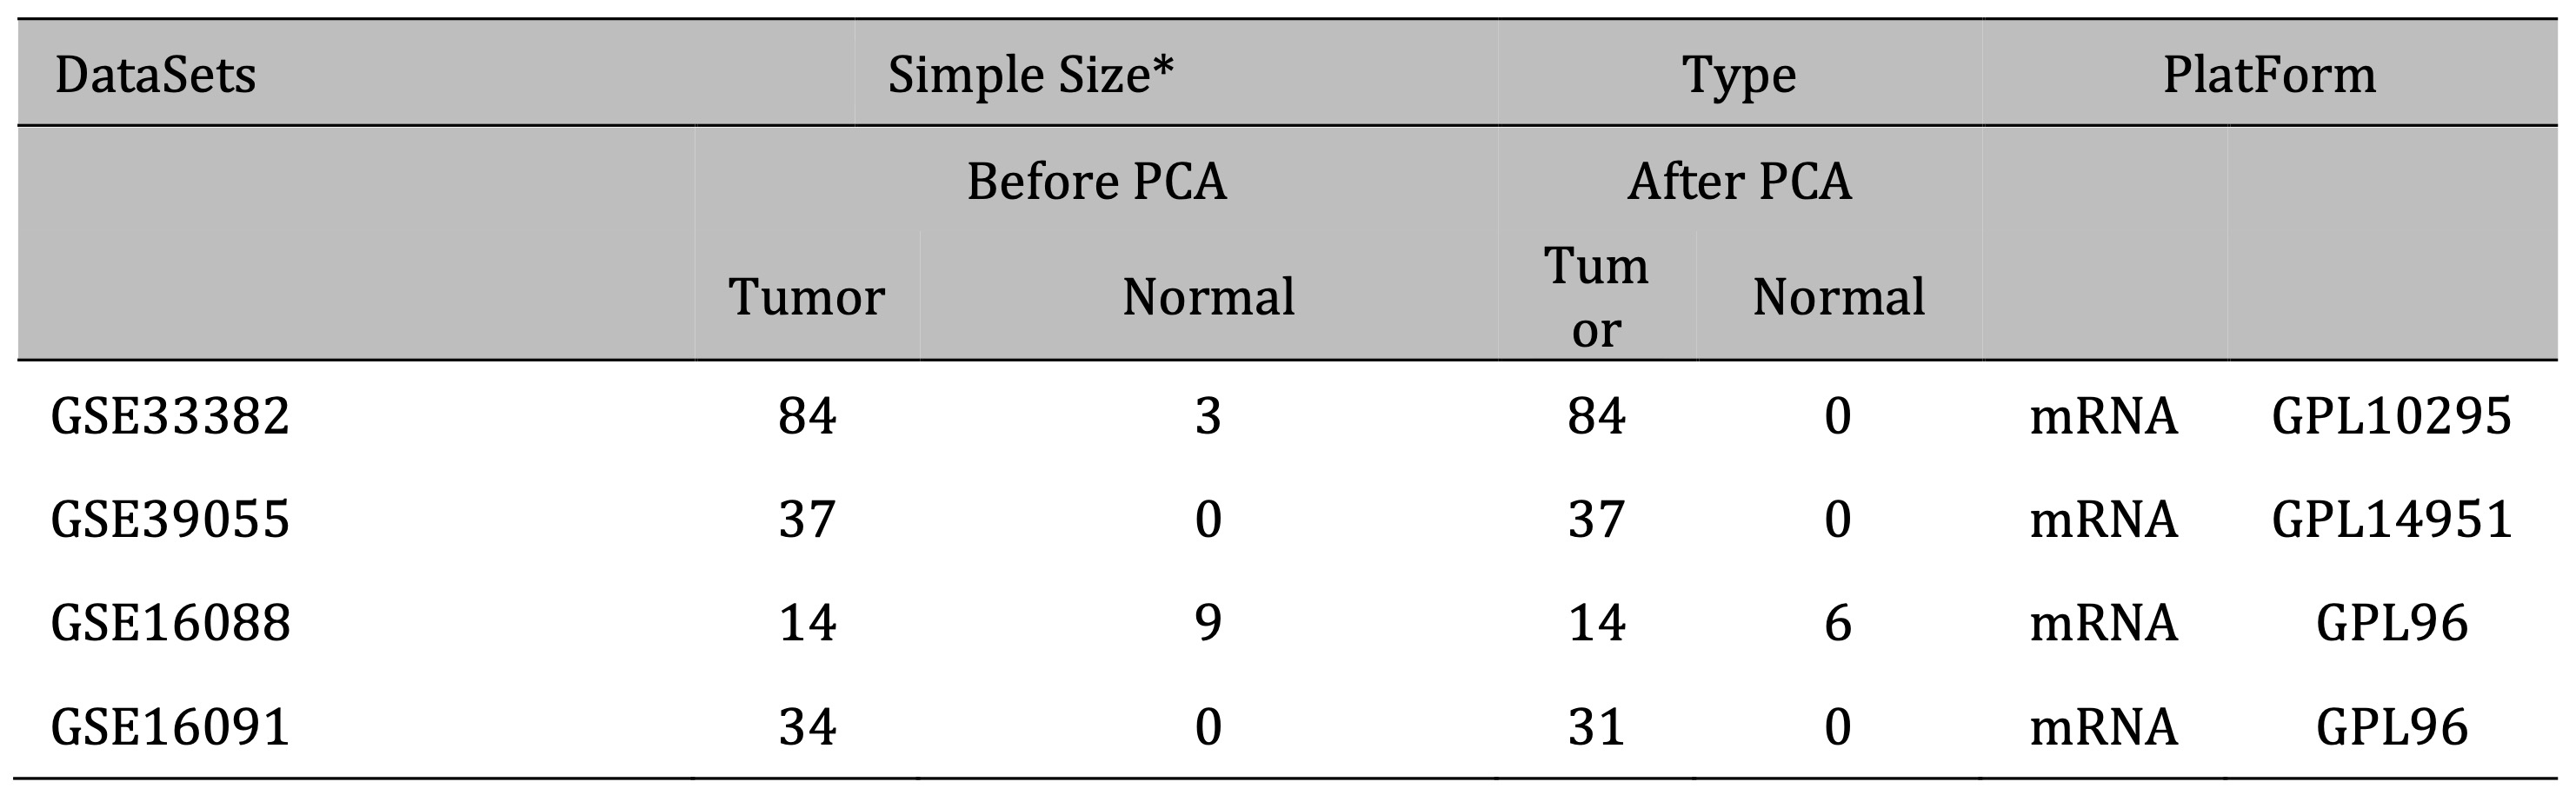
Table 1: Basic information of GEO datasets included in this study * Including repeated samples
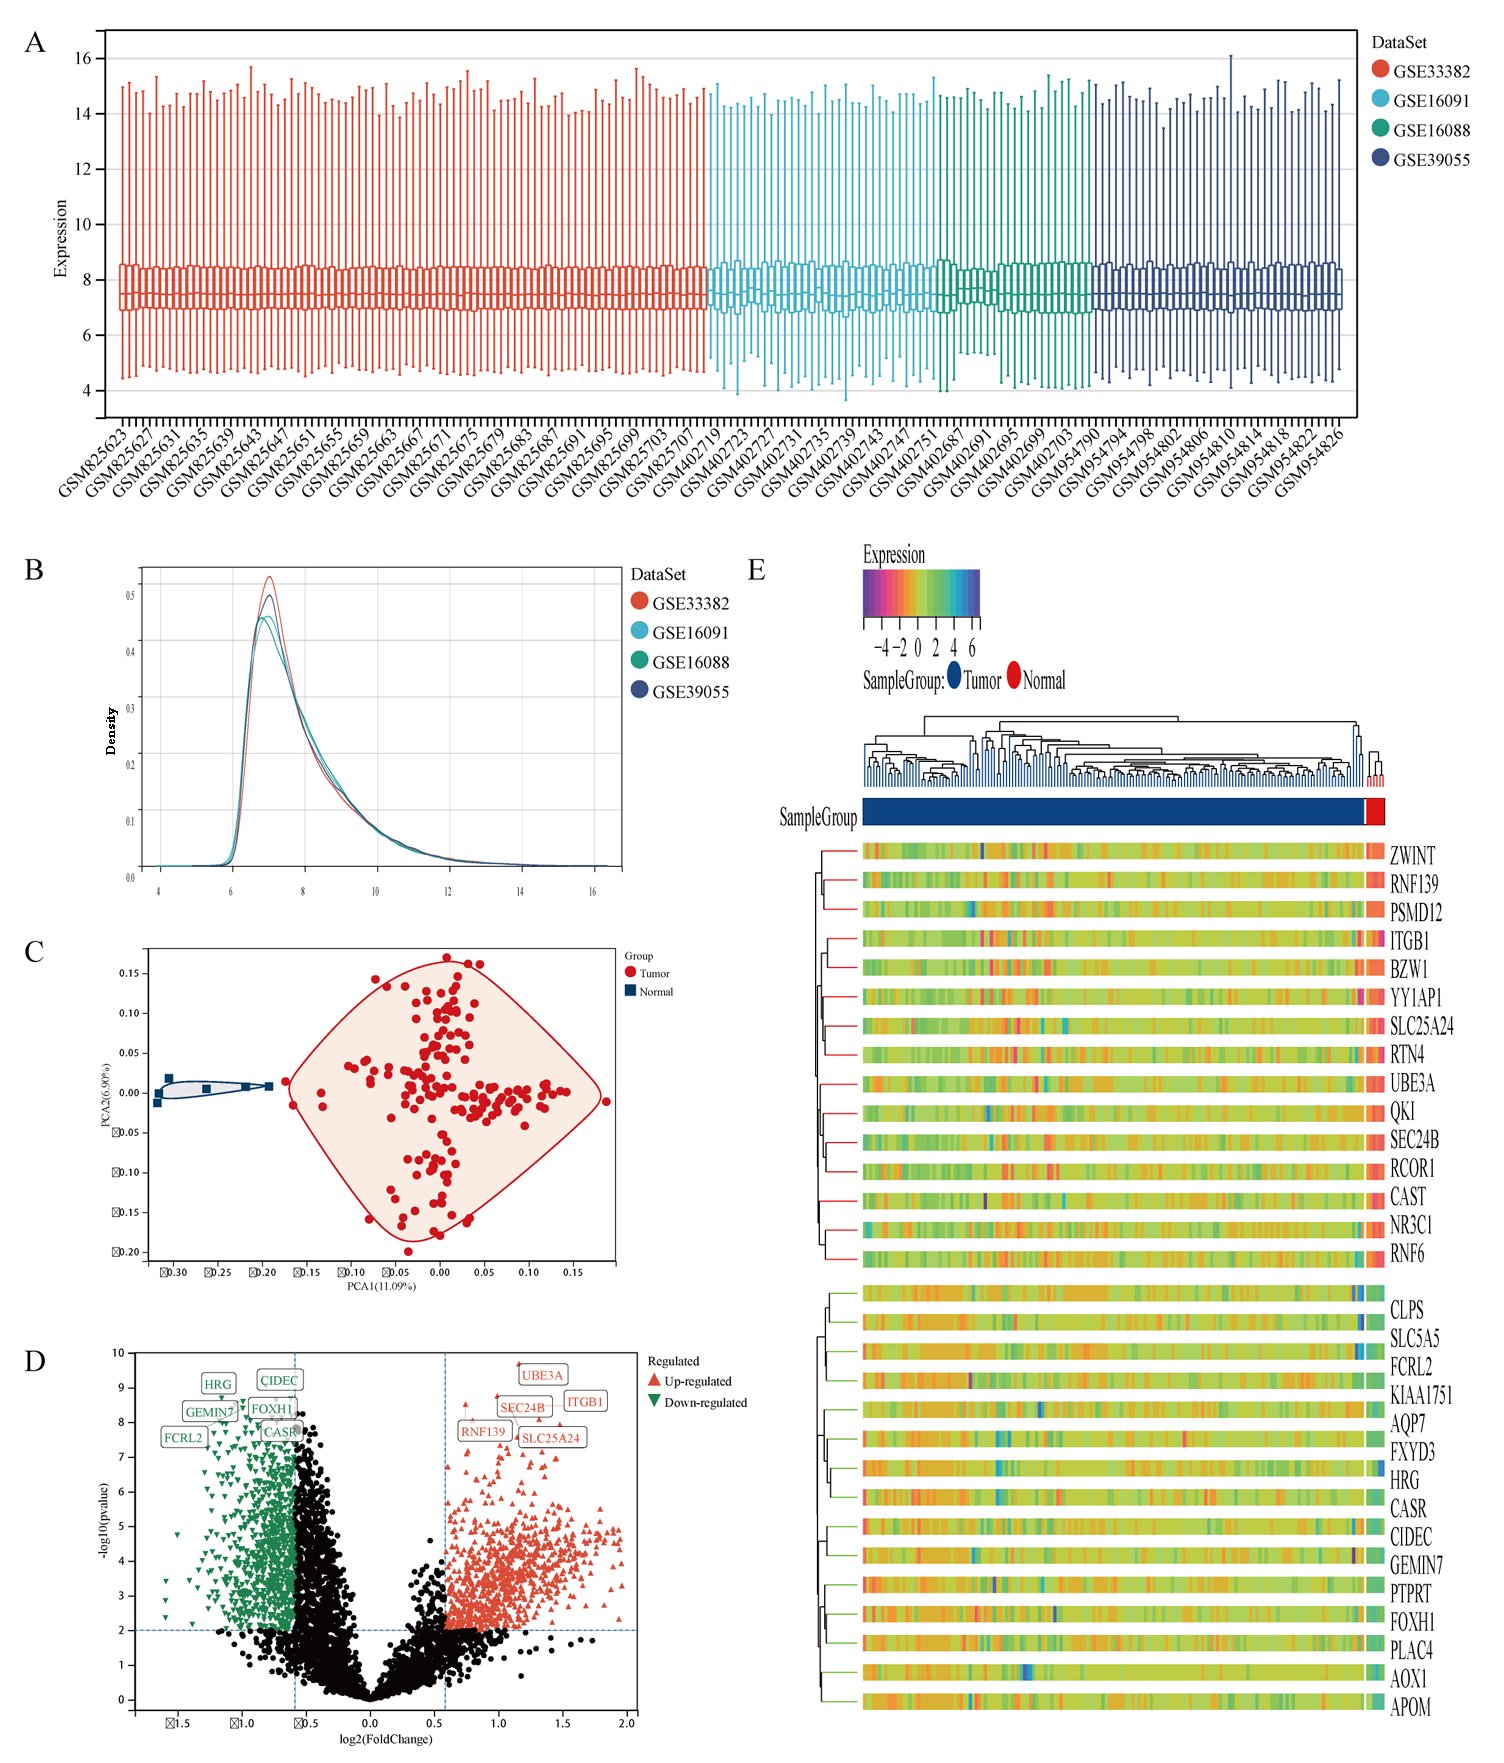
Fig. 2: Differential gene analysis of 166 osteosarcoma samples and 6 normal samples. A Dataset situation after removing batch effects. B Density distribution map of dataset after removing batch effects. C Principal Component Analysis of dataset. D The volcano plot of DEGs between osteosarcoma samples and normal samples, of which red triangles represent up-regulated DEGs and green triangles represent down-regulated DEGs. E The heatmap displays the top 30 significantly upregulated and downregulated DEGs identified from the dataset.
DEGs Functional Enrichment Analysis
Perform GO and KEGG analysis on genes with high and low expression in osteosarcoma tissue, respectively. The highly expressed genes in osteosarcoma tissue participate in cellular protein metabolic process, cell cycle, macromolecule catabolic process in biological processes (Fig. 3A). The cellular components are expressed as cytosol, protein containing complex, and nuclear part (Fig. 3B). The molecular functions mainly include nuclear acid binding, RNA binding, nucleoside binding, and protein containing complex binding (Fig. 3C). KEGG pathway analysis results show that upregulated genes can achieve various biological functions through signaling pathways such as ribosome, proteasome, ubiquitin mediated proteolysis, protein processing in endoplasmic reticulum, and participate in the occurrence and development of osteosarcoma (Fig. 3D). These results suggest that differentially expressed genes in osteosarcoma may participate in protein synthesis and metabolism through gene regulation such as RNA binding.
The biological processes of down regulated genes in osteosarcoma tissue are mainly involved in system development, response to chemical (Fig. 3E), and the cellular composition is characterized by extracellular region (Fig. 3F). The molecular function is mainly reduced by functions such as signaling receptor binding and molecular function regulator (Fig. 3G). The downregulated KEGG pathway in osteosarcoma is mainly manifested in signal pathways such as Complex and Coagulation Cascades (Fig. 3H).
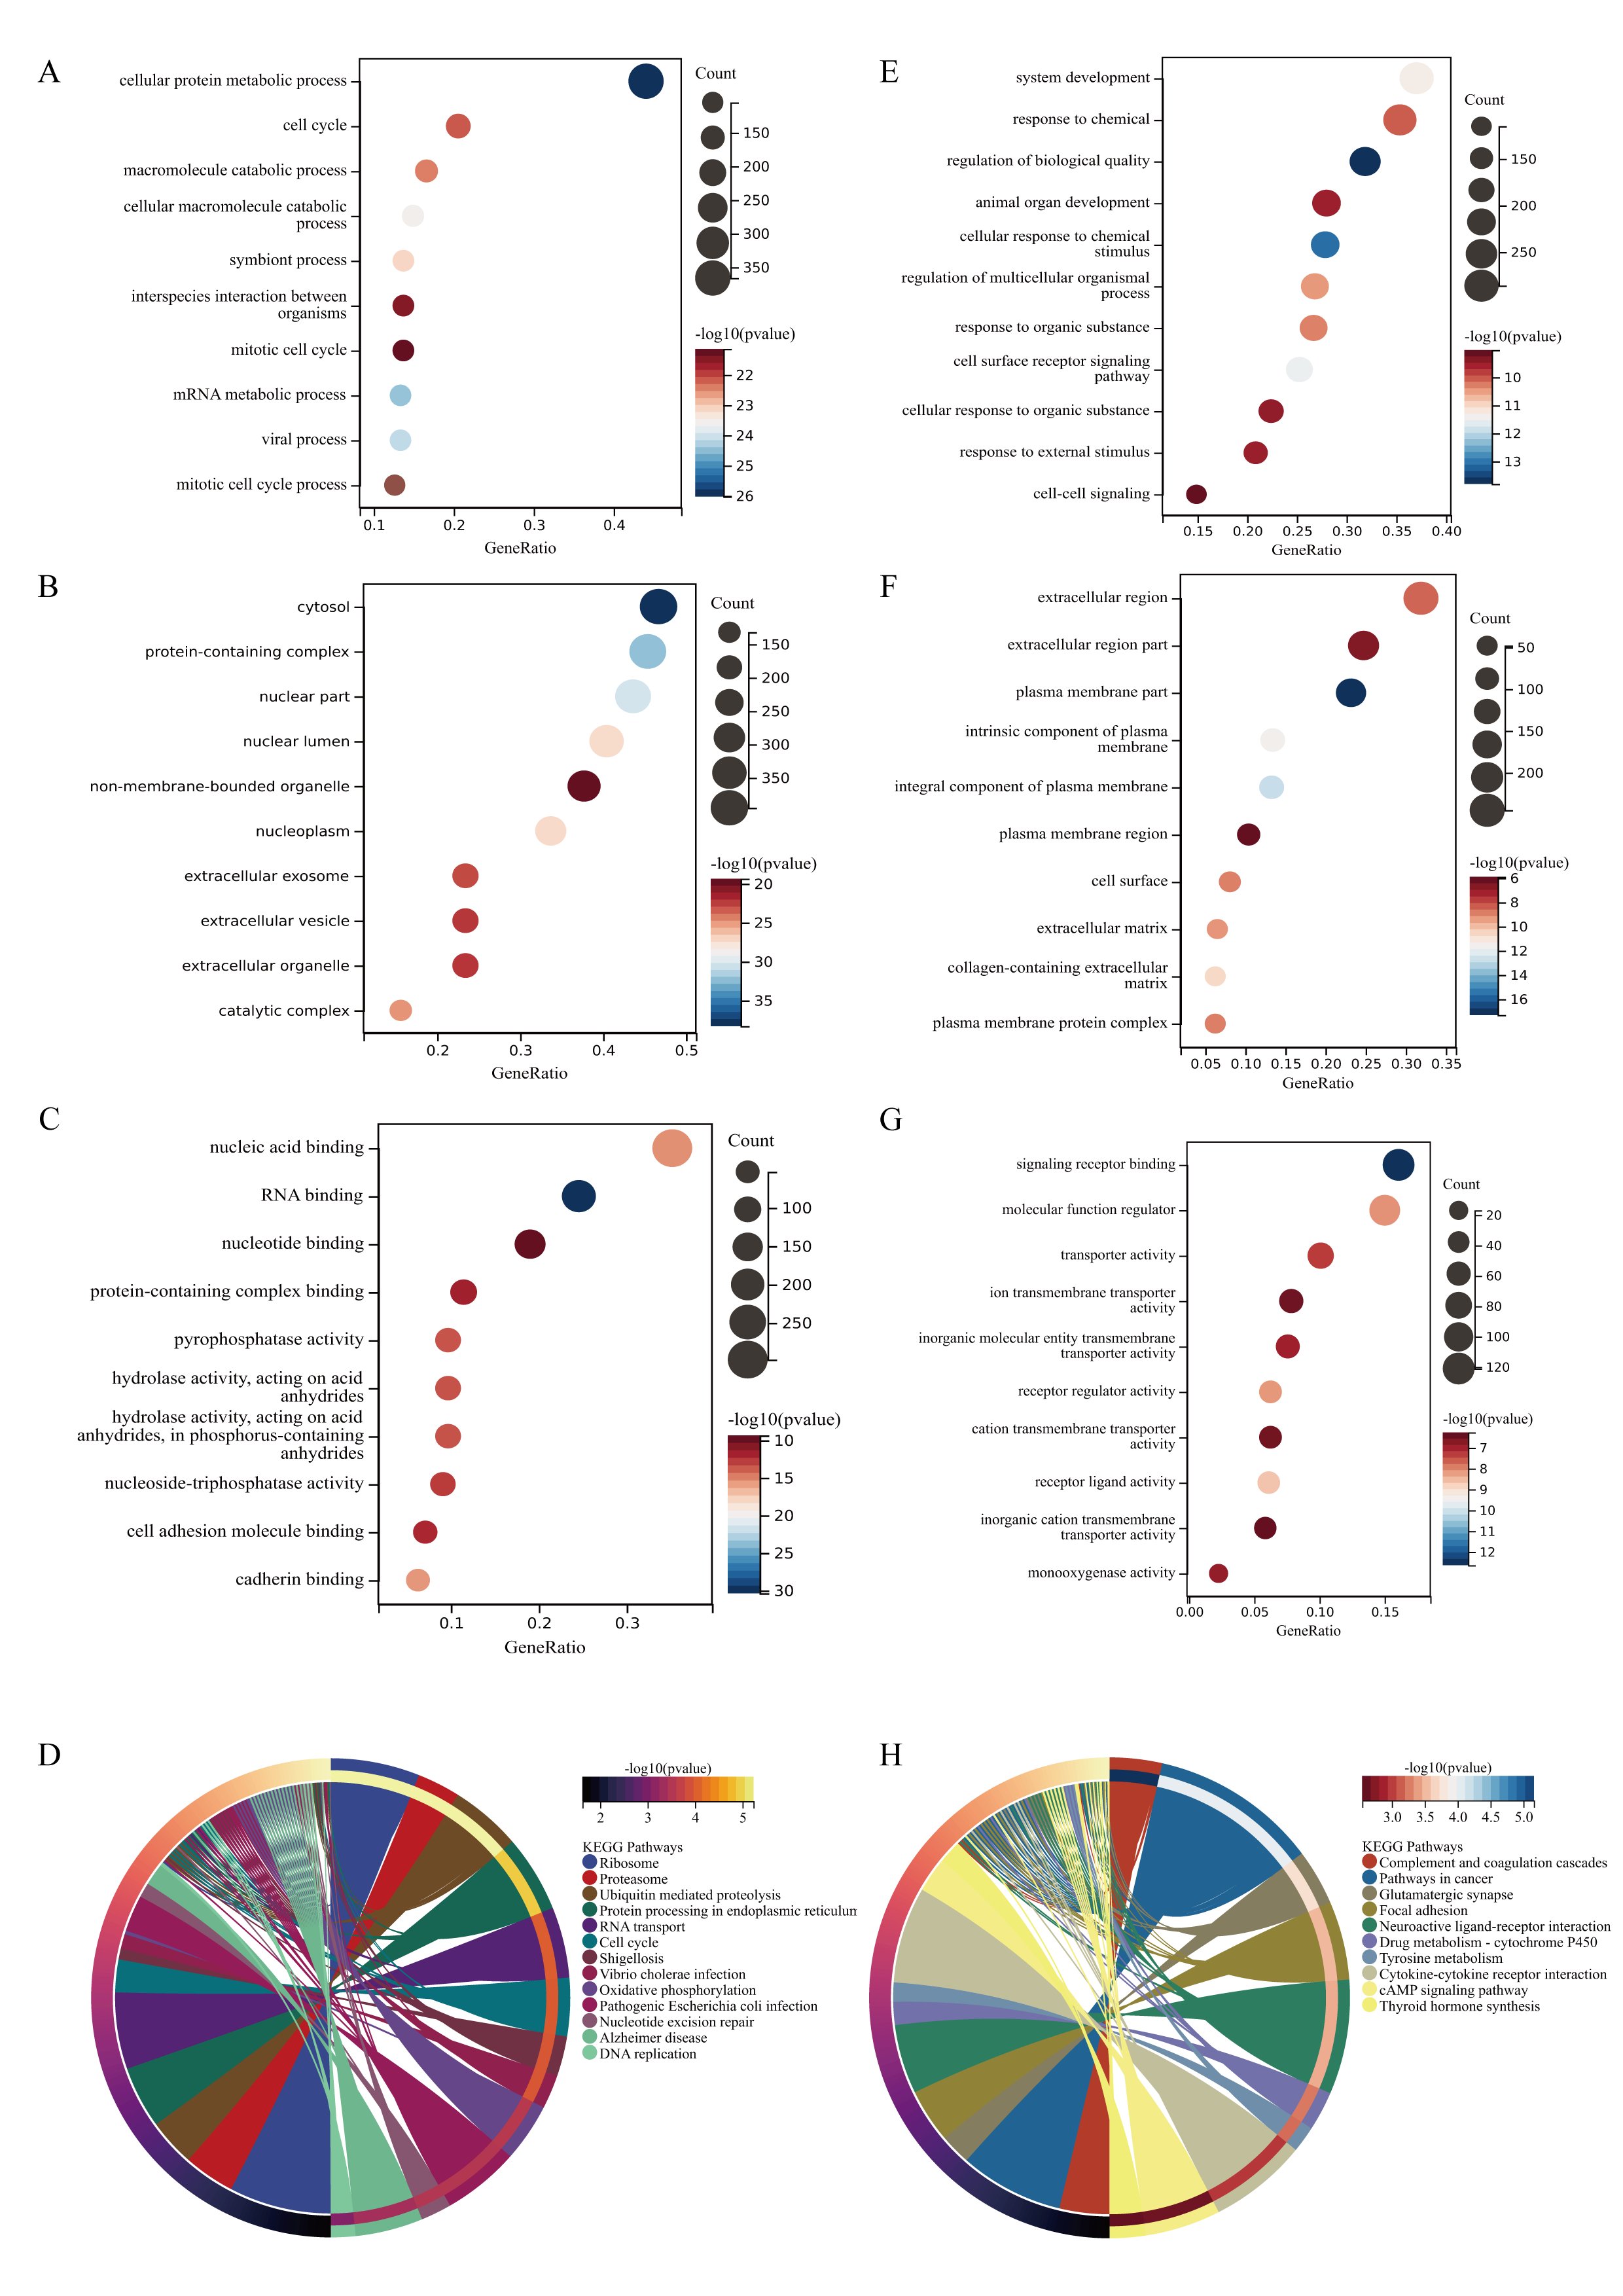
Fig. 3: GO and KEGG enrichment analysis of DEGs. A The main biological processes involved in upregulated genes in DEGs. B The cellular components involved in upregulated genes in DEGs. C the molecular functions involved in upregulated genes in DEGs. D The KEGG pathways involved in upregulated genes in DEGs. E The main biological processes involved in downregulated genes in DEGs. B The cellular components involved in downregulated genes in DEGs. C the molecular functions involved in downregulated genes in DEGs. D KEGG pathway analysis of the intersection of genes. (The y-axis represents different GO terms, the x-axis represents gene ratio enriched in relative GO terms, The size of the dots reflects the number of genes enriched in relative GO terms, and the color represents P-value.)
WGCNA
WGCNA was used to construct a network based on the expression matrix of 1773 DEGs and clinical data from 166 Osteosarcoma samples. There was an asymmetric distribution in patient age, gender, huvos grade, metastasis status, survival status, and Follow up (Fig. 4A). According to the gene expression characteristics, a clustering module was identified, with a total of 8 modules (turquoise, blue, red, grey, black, yellow, brown, green) (Fig. 4B). The largest module had 591 differentially expressed genes, while the grey module had the least number of genes, including only 2 genes (Fig. 4C). Using the eigenvector values of each module to calculate the relationship between the module and clinical phenotype, the modules with the highest prognostic correlation (p=8.1e-21, correlation coefficient=-0.64) were the green and brown modules (p=1.9e-18, correlation coefficient=0.60) (Fig. 4D). Cluster analysis was conducted on different modules, and it was found that green and brown modules clustered in different branches (Fig. 4E). The green module and brown module are the two modules with the highest correlation with the clinical prognosis of osteosarcoma. MM and GS scores are strongly correlated positively with each other in the green and brown modules, with green module p=2.9e-25 r=0.83 and brown module p=3.9e-38 r=0.74 (Fig. 4F, G) Therefore, the brown and green modules were analyzed for hub genes. Based on the cut-off criteria (| MM |>0.6 and | GS |>0.8), 68 genes with high connectivity in the clinical significant module were identified as hub genes (Supplementary File 2). The protein-protein interaction (PPI) network was constructed for the genes in the target module, and the results were imported into Cytoscape to construct the core gene interaction network (Fig. 4H).
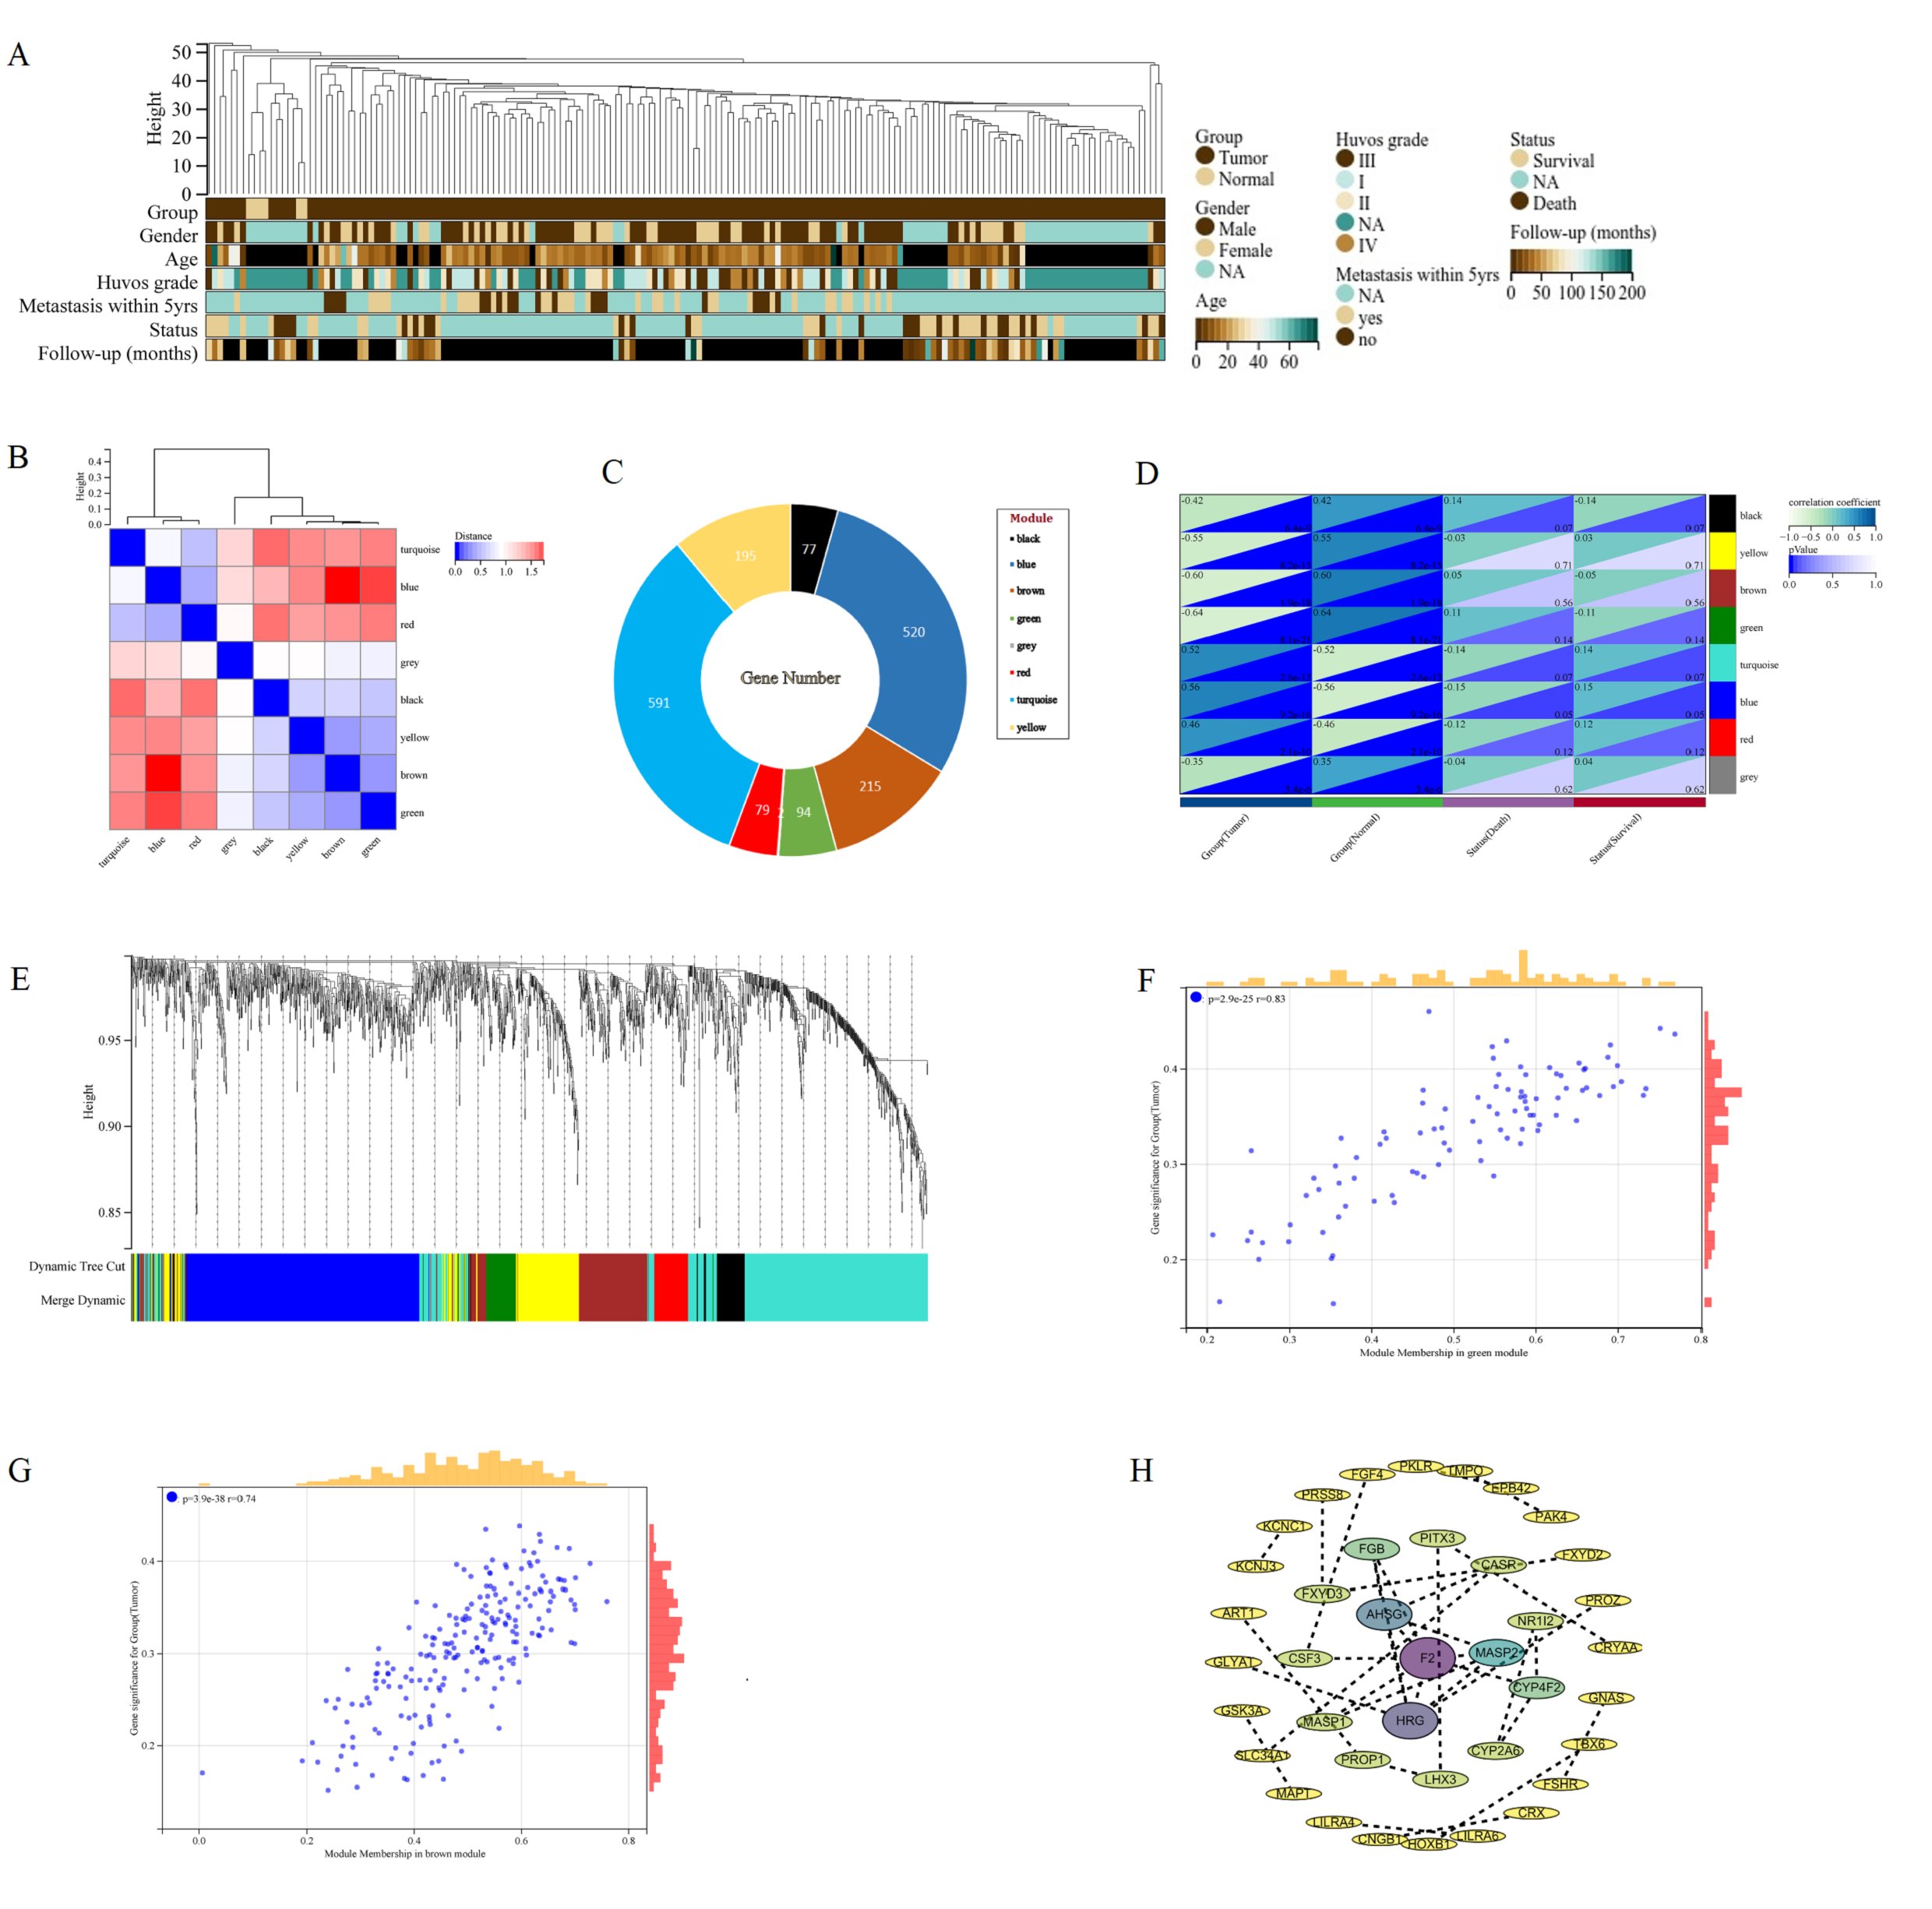
Fig. 4: WGCNA of DEGs in osteosarcoma. A The landscape of clinical traits of 166 osteosarcoma and 6 normal samples in the dataset. B Heatmap of eigengene adjacency. C Lifebuoy plot of the number of genes in eight modules. D Evaluate the correlations between module eigengenes and clinical traits. E Cluster dendrogram of gene co expression modules. Each branch represents a gene, and each color represents a co expressed module. F Scatter plot of GS and MM of green module genes. G Scatter plot of GS and MM of brown module genes. H PPI network diagram of hub genes screened by the target module.
Hub gene determination and prognostic analysis
To verify whether hub genes do indeed affect the prognosis of osteosarcoma patients in clinical practice, we first evaluated the prognostic significance of each hub gene using the multivariate COX analysis. The results showed that PROP1, F2, GNAS, CRYAA, LHX3, CNGB1, CHRNA2, CYP4F2 and TNR were significantly correlated with patient survival (Fig. 5A). Further analysis of KM survival of the aforementioned genes revealed a significant correlation between high expression of PROP1, GNAS, and CYP4F2 and patient poor survival, which are unfavorable prognostic genes for osteosarcoma (Fig. 5B-D). LHX3 and CNGB1 are low expressed and have a long survival time, making them favorable genes for OS prognosis (Fig. 5E, F). To verify this result, analysis of GSE197158 data revealed that CNGB1 expression was very low, close to 0. LHX3 and CYP4F2 were expressed higher in normal bone tissue than in osteosarcoma cells, and the expression difference was statistically significant (Fig. 5G). GNAS expression is increased in both normal bone tissue and osteosarcoma tissue, and higher in osteosarcoma tissue, with a statistically significant difference [Fig. 5H]. It is weird why GNAS is expressed so high in osteosarcoma tissue, and its expression level is higher than most genes. Does GNAS play the vital role of oncogene in the progression of osteosarcoma? So, we analyzed the GNAS expression data in TAEGET-OS data and found that the expression of GNAS was still very high in osteosarcoma tissue, while the expression of LHX3, PROP1, CNGB1, and CYP4F2 were all very low, tending towards 0. The data were all standardized with log2 (norm_count+0.001) (Fig. 5I). To verify whether GNAS is also highly expressed in other types of tumors. We downloaded pan cancer datasets that have been standardized through log2 (x+0.001) transformation. GNAS expression is lower in 34 types of tumors than in osteosarcoma tissue. Moreover, GNAS expression is higher in 22 types of tumors than in normal tissues, while it is only low in 4 types of tumors (Supplementary Fig. 3). Survival analysis found that high expression of GNAS was associated with poor prognosis in eight types of cancer, including KIRC, UVM, MESO, STAD, LAML, STES, SARC, LIHC (Fig. 5J-Q). This may be related to the role of GNAS in bone tissue osteogenesis after tumor bone metastasis. Unfortunately, there is no data on osteosarcoma in the pan cancer dataset. Therefore, we conducted validation analysis on clinical osteosarcoma samples.
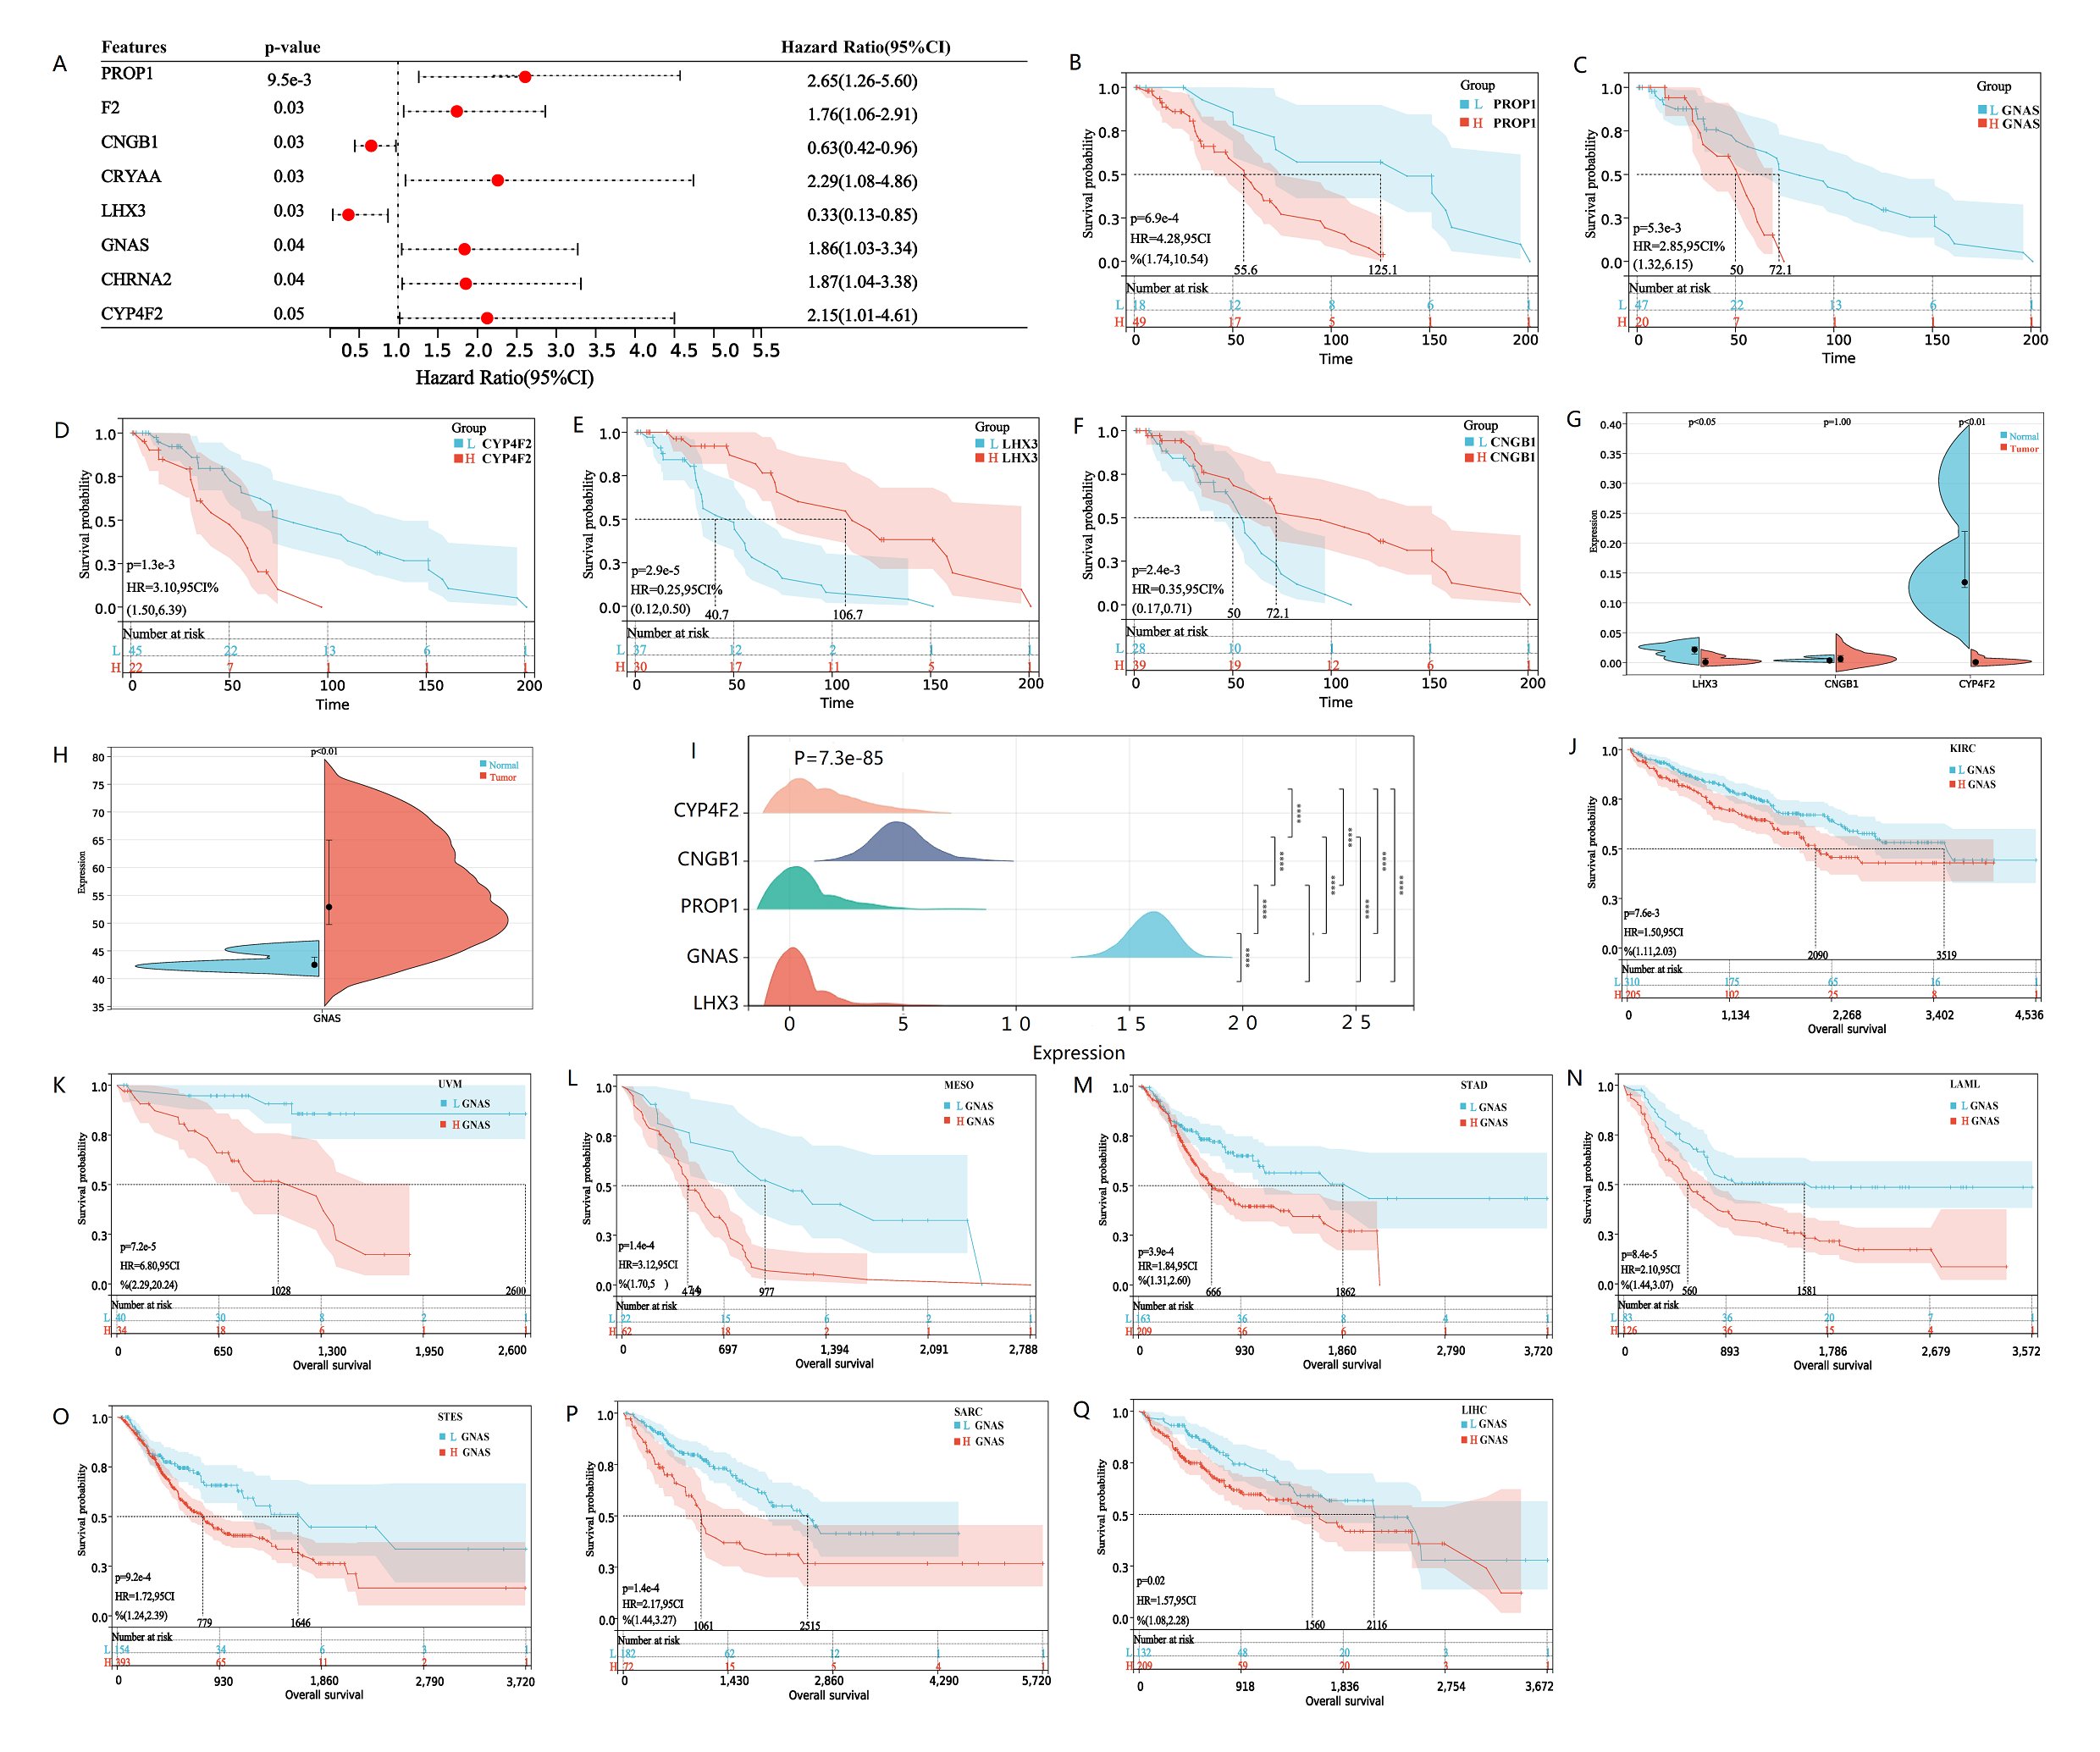
Fig. 5: Survival analysis of hub genes, GNAS expression and pan cancer survival analysis. A The forest map displays hub genes related to patient survival. Hub genes with HR greater than 1 are poor prognostic genes, while hub genes with HR less than 1 are good prognostic genes. B-F Kaplan Meier survival curve analysis of osteosarcoma patients based on low or high expression of PROP1, GNAS, CYP4F2, LHX3 and CNGB1. The cutoff of the group is the optimal cut-off expression value of hub genes. The significance of the prognostic value was tested by a log-rank test. G-H The violin plots shows the expression levels and differences of CNGB1, LHX3, CYP4F2 and GNAS in normal and osteosarcoma tissues in GSE197158 database, with P value less than 0.05 indicating genes expression differences between samples. The expression level of GNAS is much higher than other hub genes, so it is placed separately on a violin plot (H). I Ridgeline plot shows the expression differences of Hub genes validated by TARGET-Osteosarcoma database. J-Q Kaplan Meier survival curve showed that there were survival differences in the high and low expression of GNAS in KIRC, UVM, MESO, STAD, LAML, STES, SARC and LIHC. The significance of the prognostic value was tested by a log-rank test. P<0.05 indicates statistically significant survival outcomes.
Expression of GNAS in cancer and adjacent normal tissues from clinical data
The Ki-67 antigen was first identified by Gerdes and colleagues in 1983 with the use of a mouse monoclonal antibody, Ki-67 antigen present in the nucleus and is expressed throughout the cell cycle except G0 phase [25]. High expression of Ki67 suggests proliferation of osteosarcoma cells and is significantly associated with a decrease in survival rate in osteosarcoma patients [26]. Therefore, we further confirmed the expression of GNAS and Ki-67 in osteosarcoma and adjacent normal tissues via hematoxylin/eosin (H&E) staining and immunohistochemistry. Morphological change was determined using hematoxylin/eosin (H&E) staining in osteosarcoma tissues and adjacent normal tissues (Fig. 6A, B). Results from immunohistochemistry showed that Gs-alpha was stained mainly located in cytoplasm of osteosarcoma cells, While Ki-67 was present in the nucleus of osteosarcoma cells. We found that the expression levels of Gs-alpha and Ki-67 proteins were dramatically increased in osteosarcoma cells, while their expression levels were lower in adjacent normal tissues (Fig. 6C-F). The experimental results are consistent with the RNA seq data from GEO database.
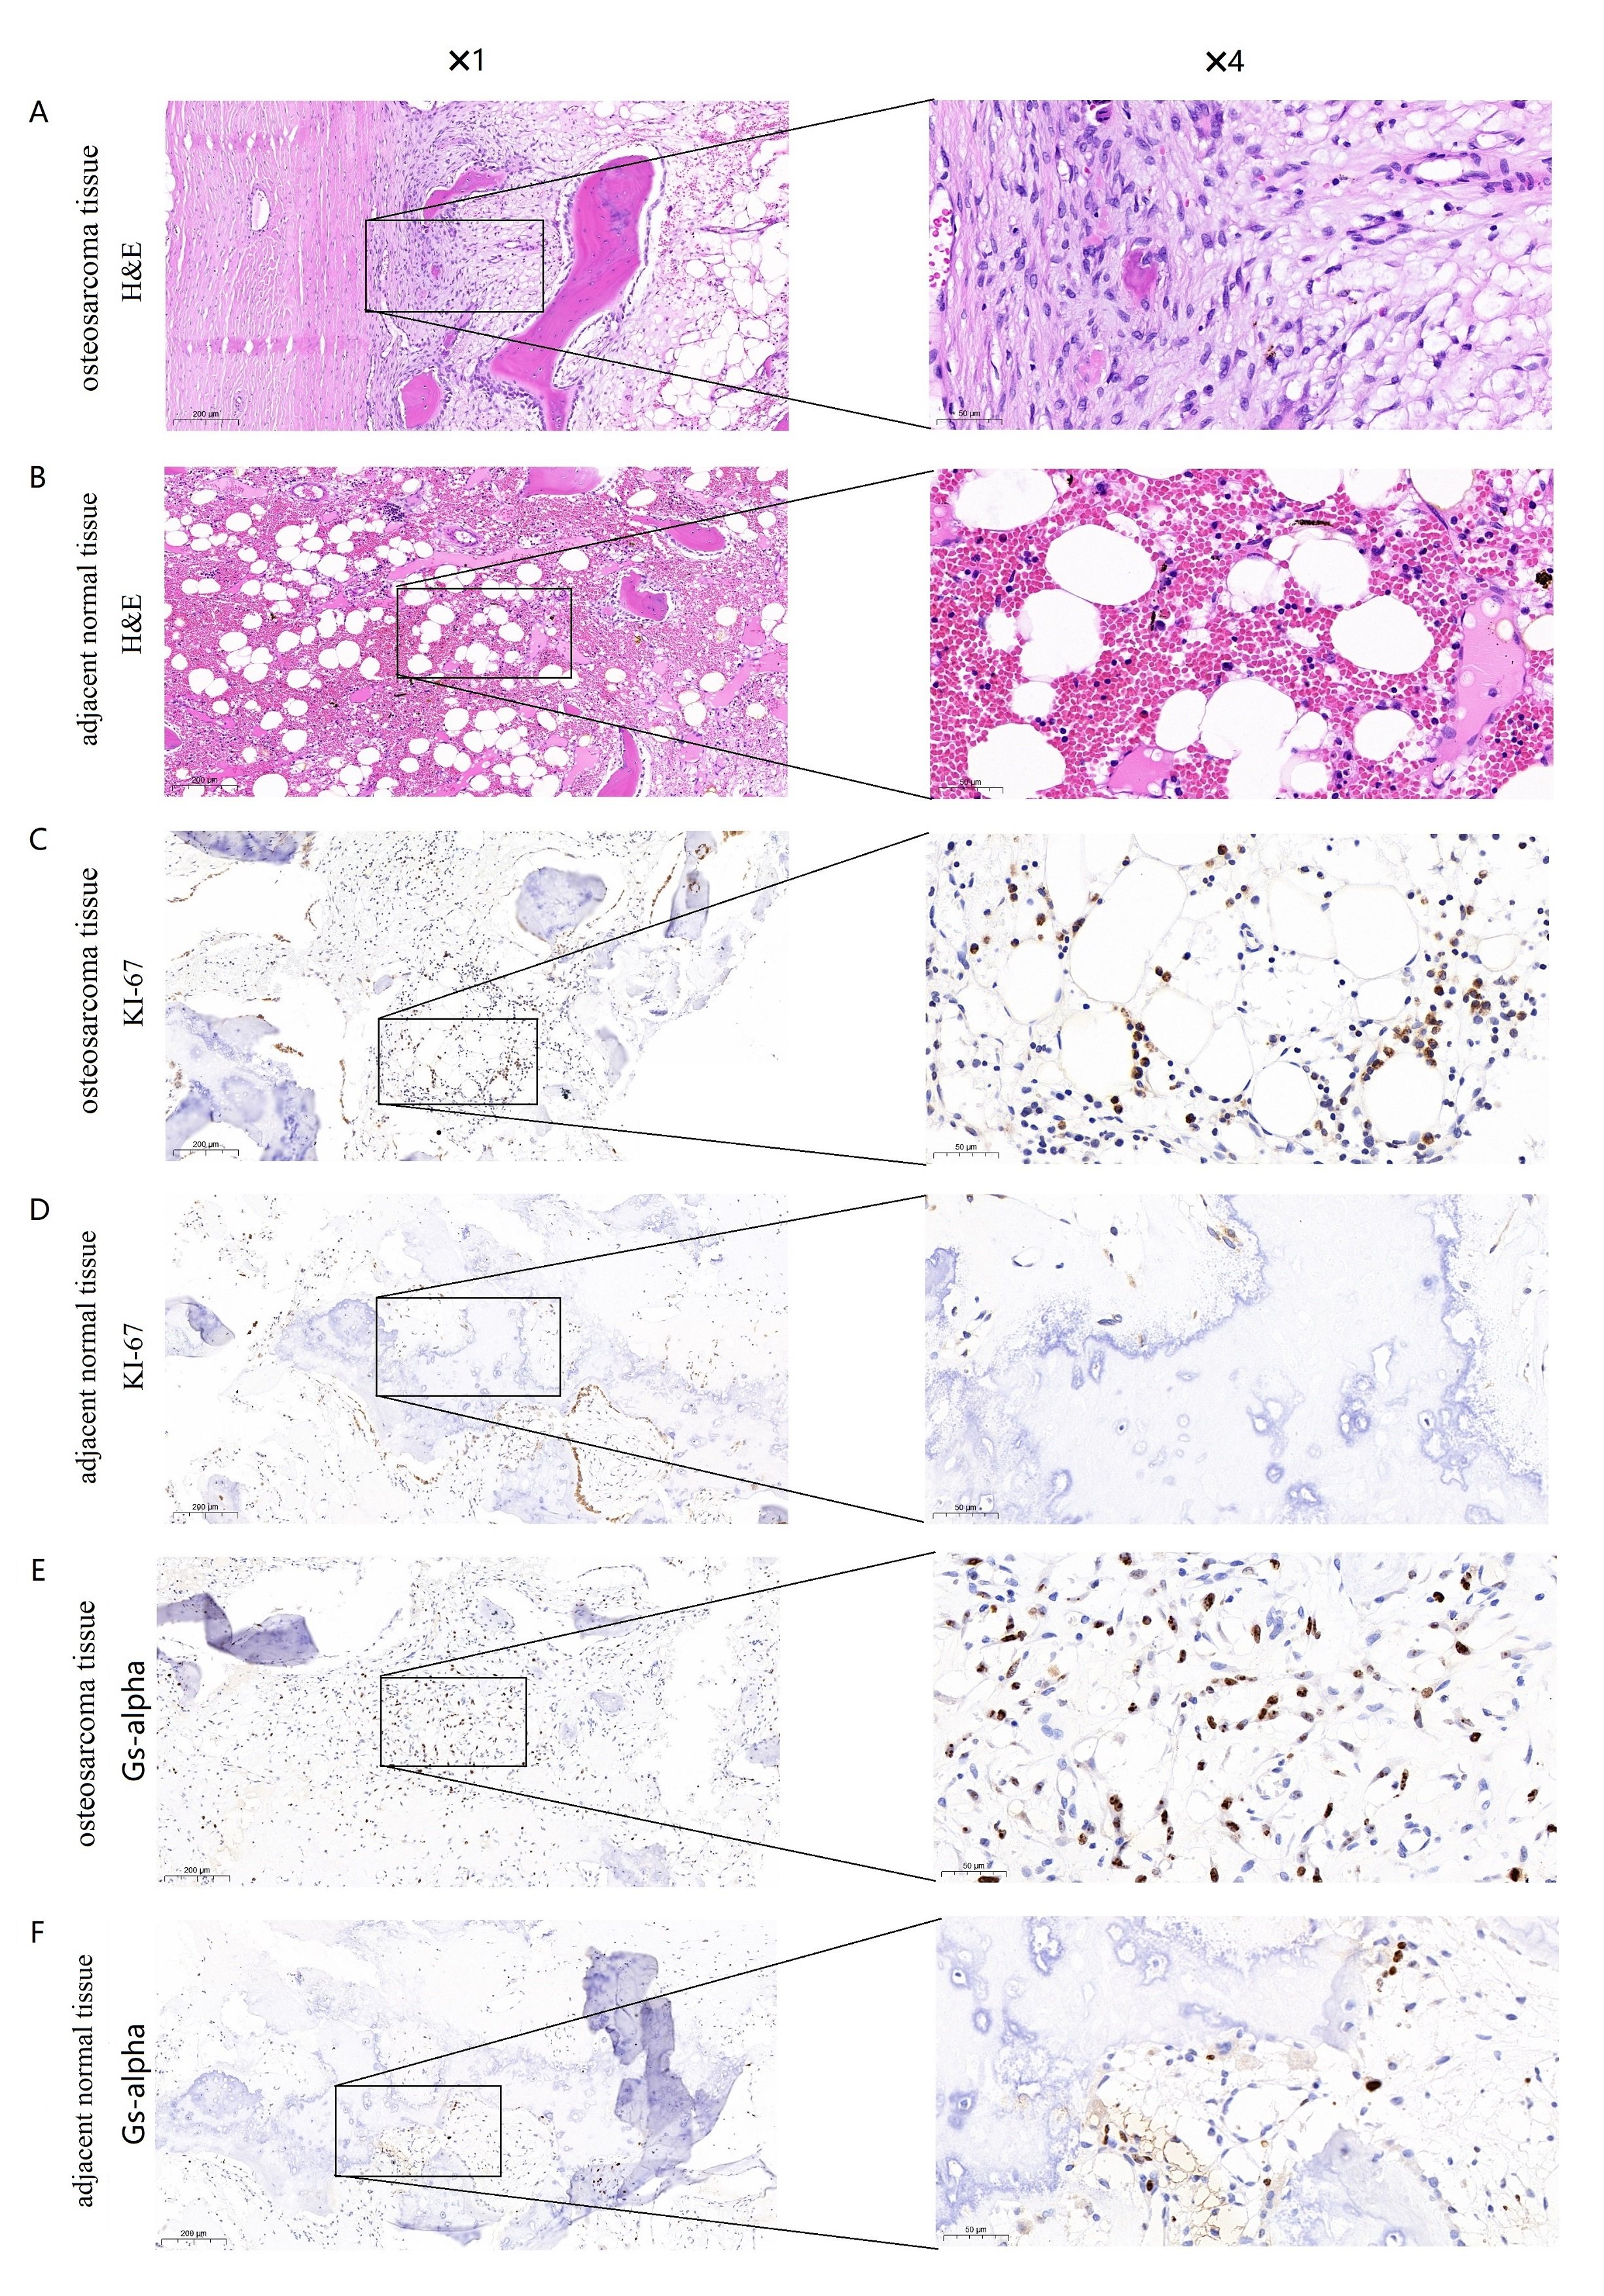
Fig. 6: Expression of Gs-alpha and Ki-67 in osteosarcoma tissues and adjacent normal tissues. (A) Hematoxylin/eosin (H&E) staining of osteosarcoma tissues with Gs-alpha expression (original magnification 1 and4). (B) HE staining of adjacent normal tissues with Gs-alpha expression (original magnification 1 and 4). (C) Immunohistochemical staining for Gs-alpha in osteosarcoma tissues (original magnification 1 and 4). (D) Immunohistochemical staining for Gs-alpha in adjacent normal tissues (original magnification 1 and 4). (E) Immunohistochemical staining for Ki-67 in osteosarcoma tissues (original magnification 1 and 4). (F) Immunohistochemical staining for Ki-67 in adjacent normal tissues (original magnification 1 and 4).
GNAS mutation landscape
Studies have shown that GNAS mutations play an important role in various diseases [10-12]. Therefore, we investigated whether GNAS also exhibits high mutations in soft tissues and bone sarcomas. We used CBioPortal to analyze the GNAS gene mutations in 7494 samples of soft tissues and bone sarcomas, and compared it with the high mutation gene TP53 [27]. We found that the GNAS gene had a mutation rate of 0.2% in soft tissues and bone sarcomas, with mutations mainly concentrated in missense mutations, while TP53 gene had a mutation rate of up to 31% in the samples, the main types of mutation include inframe mutation, missense mutation, splice mutation and structural variant (Fig. 7 A). GNAS alters the Gs-alpha protein R201H/C in Osteosarcoma, and the G-alpha Y163 * in Uterine Leiomysarcoma, which is a non-sense mutation. After GNAS gene mutation, Post Translational Modifications (PTMs) are mainly manifested in phosphorylation, ubiquitination and palmitoylation. After TP53 mutation, RB1-TP53 fusion, ACVR1B-TP53 fusion, CUX1-TP53 fusion, NF2-TP53 fusion, MAP2K4-TP53 fusion, V10I, E11Q, W23*, P27Lfs*17, V31I, X32 splice, AA Change R273H/C/L/P/S appeared. After TP53 mutation, PTMs were mainly manifested as phosphorylation, acetylation, ubiquitination, methylation, glutathionylation, O-linked glycosylation, S-nitrosylation, sumoylation (Fig. 7B). Compared with TP53 mutation count, GNAS mutations are mainly single Missense (Driver) mutations (Fig. 7C). Further research on mutation rates of GNAS in Pan caner revealed that GNAS had the highest mutation rate in UCEC (37/531), and the mutation rate in sarcoma tissue was less than 0.01 (4/239) (Fig. 7D). These results indicate that GNAS does not affect the poor prognosis of osteosarcoma patients in the form of mutations.
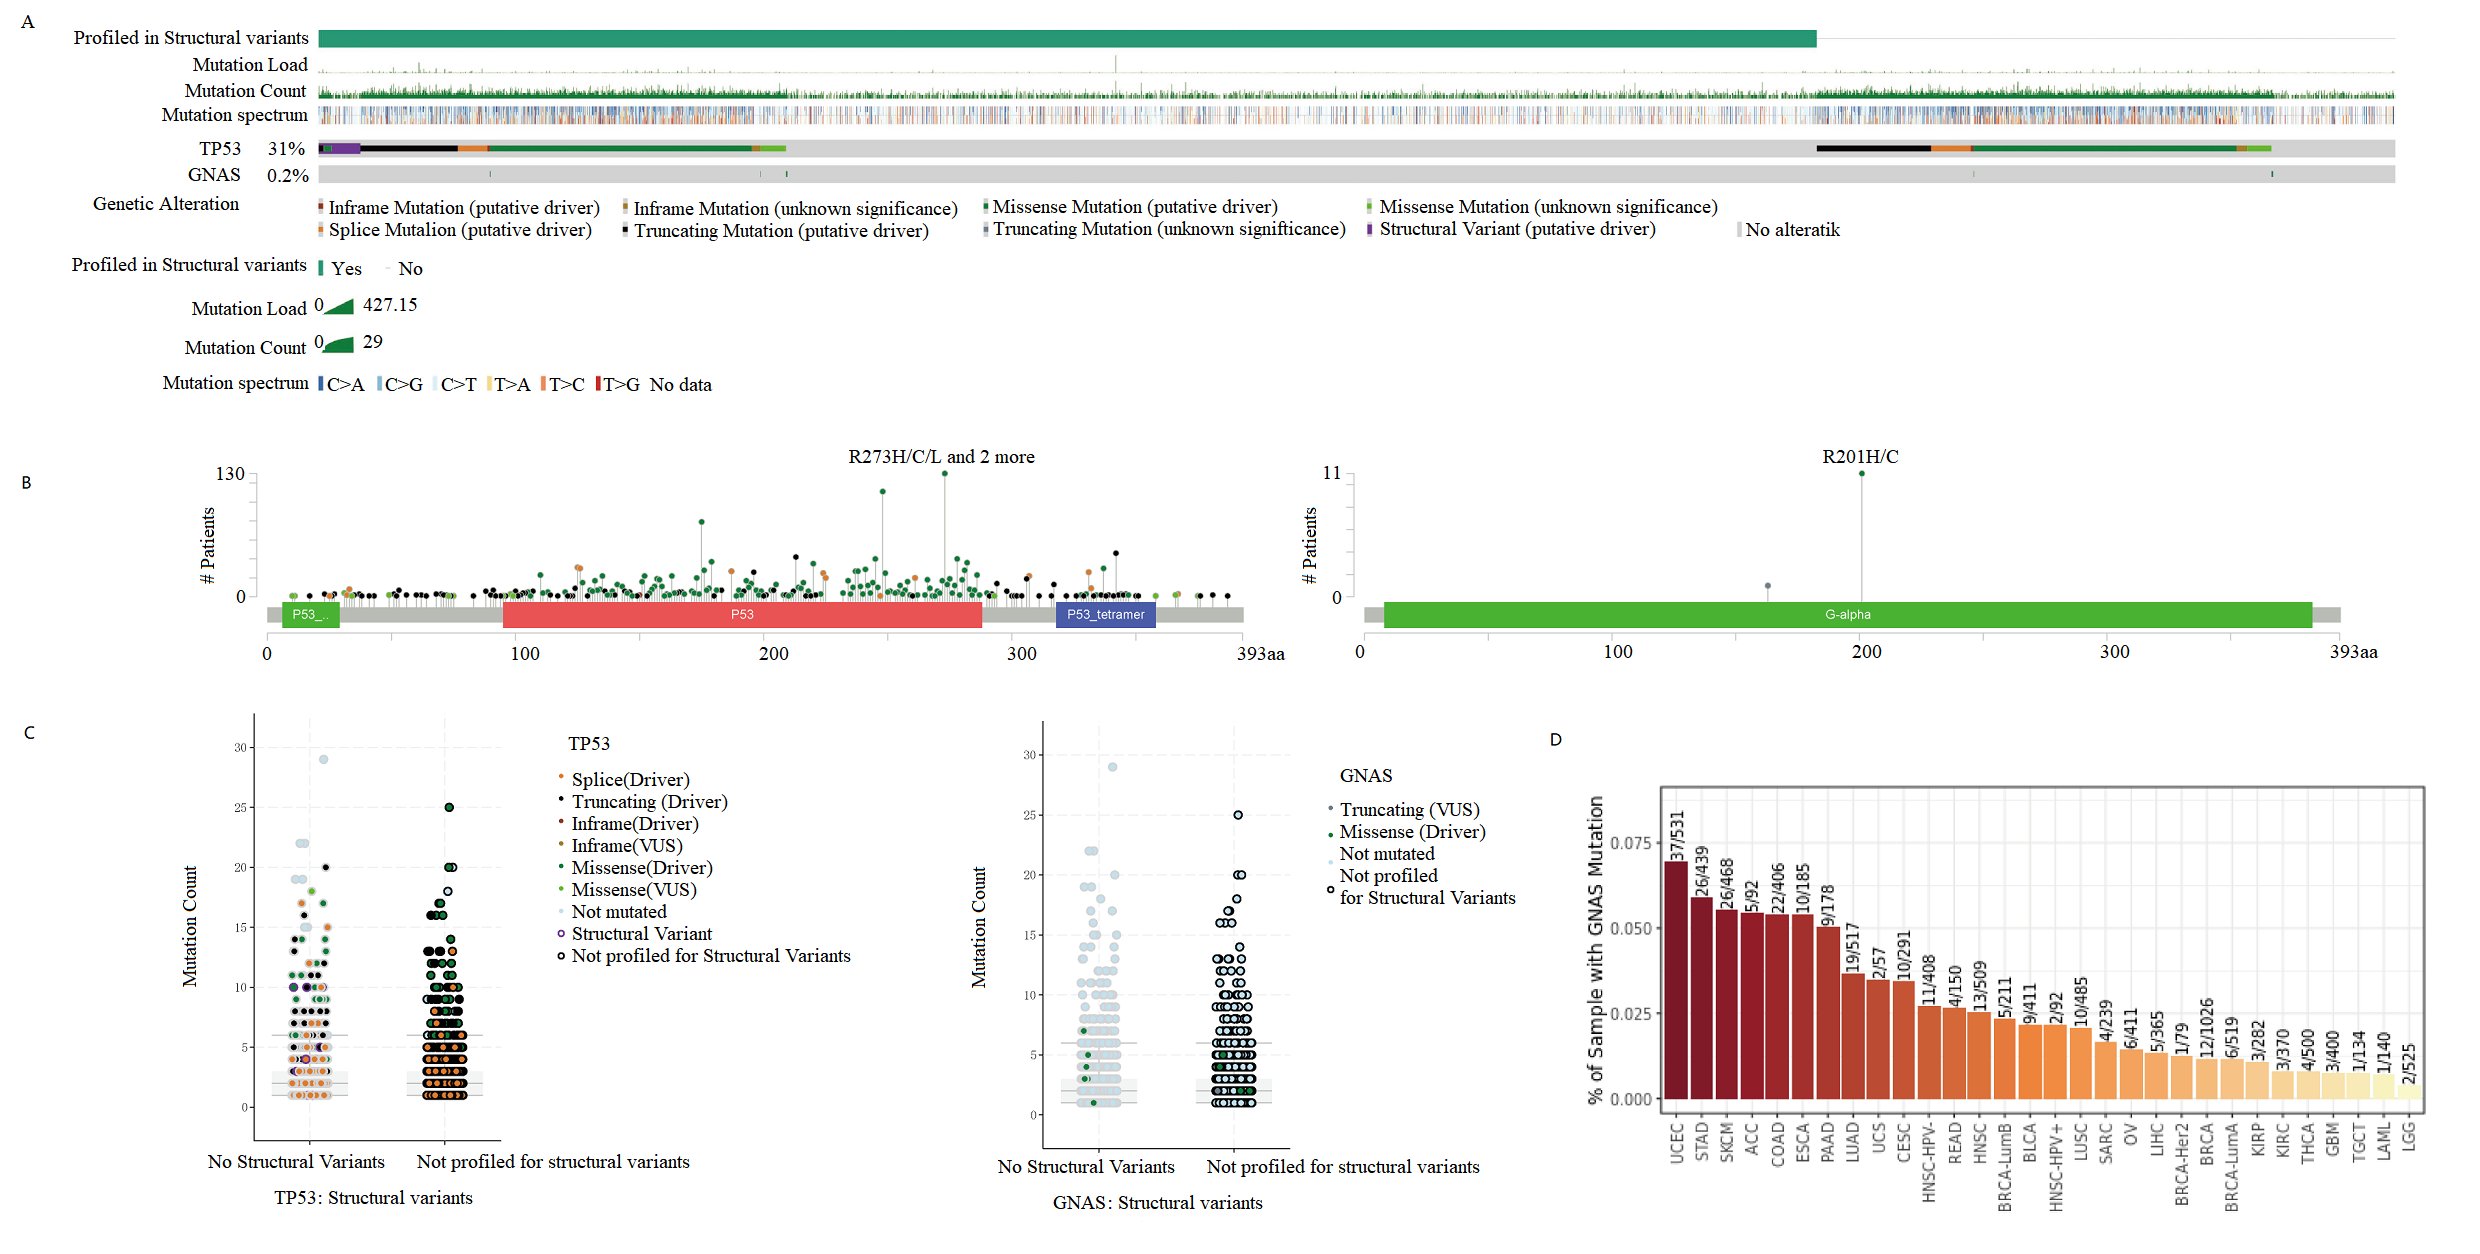
Fig. 7:Mutant Landscape in GNAS Based on CBioPortal. A Bar plot showing mutations in the GNAS and TP53 gene. B Lollipop plots showing the distributions of mutations in different domains of the proteins encoded by the GNAS and TP53 gene. C Scatter plots showing the specific mutation forms of GNAS and TP53 gene. D Histogram displays the mutation frequency of GNAS gene in pan cancer.
Animal experiment
Plot the growth curve of the transplanted tumor on days 3, 6, 9, 12, and 15 with or without siRNA GNAS treatment. The weight of nude mice in the GNAS siRNA treatment group decreased compared to the negative control group and blank group, but there was no statistically significant difference between the groups (P>0.05, Fig. 8A). The tumor volume of the GNAS siRNA treatment group of nude mice began to differ on the 6th day. On the 9th day after siRNA GNAS intervention, the tumor volume of the experimental group of nude mice significantly slowed down compared to the negative control group and blank group, and the difference between the groups was statistically significant (P<0.05, Fig. 8B). After 2 weeks of subcutaneous treatment in different groups of nude mice, the animals were euthanized and subcutaneous tumors were isolated (Fig. 8C), and the tumor volume was measured. The final tumor volume of the normal group, negative control group, and GNAS siRNA treatment group were (664.39 ± 28.94), (661.36 ± 43.09), and (503.35 ± 57.19) mm3, respectively. The final tumor volume of the experimental group was significantly reduced compared to the blank group and negative control group (P<0.05). The TGI value of the negative control group and the GNAS siRNA treatment group were 0.93% and 15.52%, respectively. After knocking down GNAS in vivo, the growth of subcutaneous tumors in 143B nude mice was inhibited. Further pathological staining of the tumor tissue was performed, and HE staining revealed that the tumor tissue treated with GNAS siRNA had reduced cell volume, shrinked cell membrane, and concentrated nuclei (Fig. 8D). TUNEL staining significantly observed higher green fluorescence than the control group, indicating that osteosarcoma cells underwent certain apoptosis after knocking down GNAS in vivo (Fig. 8E).
RT-PCR analysis of tumor tissue revealed a significant decrease in GNAS mRNA expression levels in osteosarcoma tissue after knocking down GNAS (P<0.05, Fig. 8F). WB analysis found that the expression of Gs-alpha was significantly reduced in tumors tissue after knocking down GNAS in vivo (P<0.01, Fig. 8G). The above experimental studies showed that GNAS plays the role of oncogene in osteosarcoma cells, and inhibited GNAS expression resulted in varying degrees of apoptosis in osteosarcoma cells.
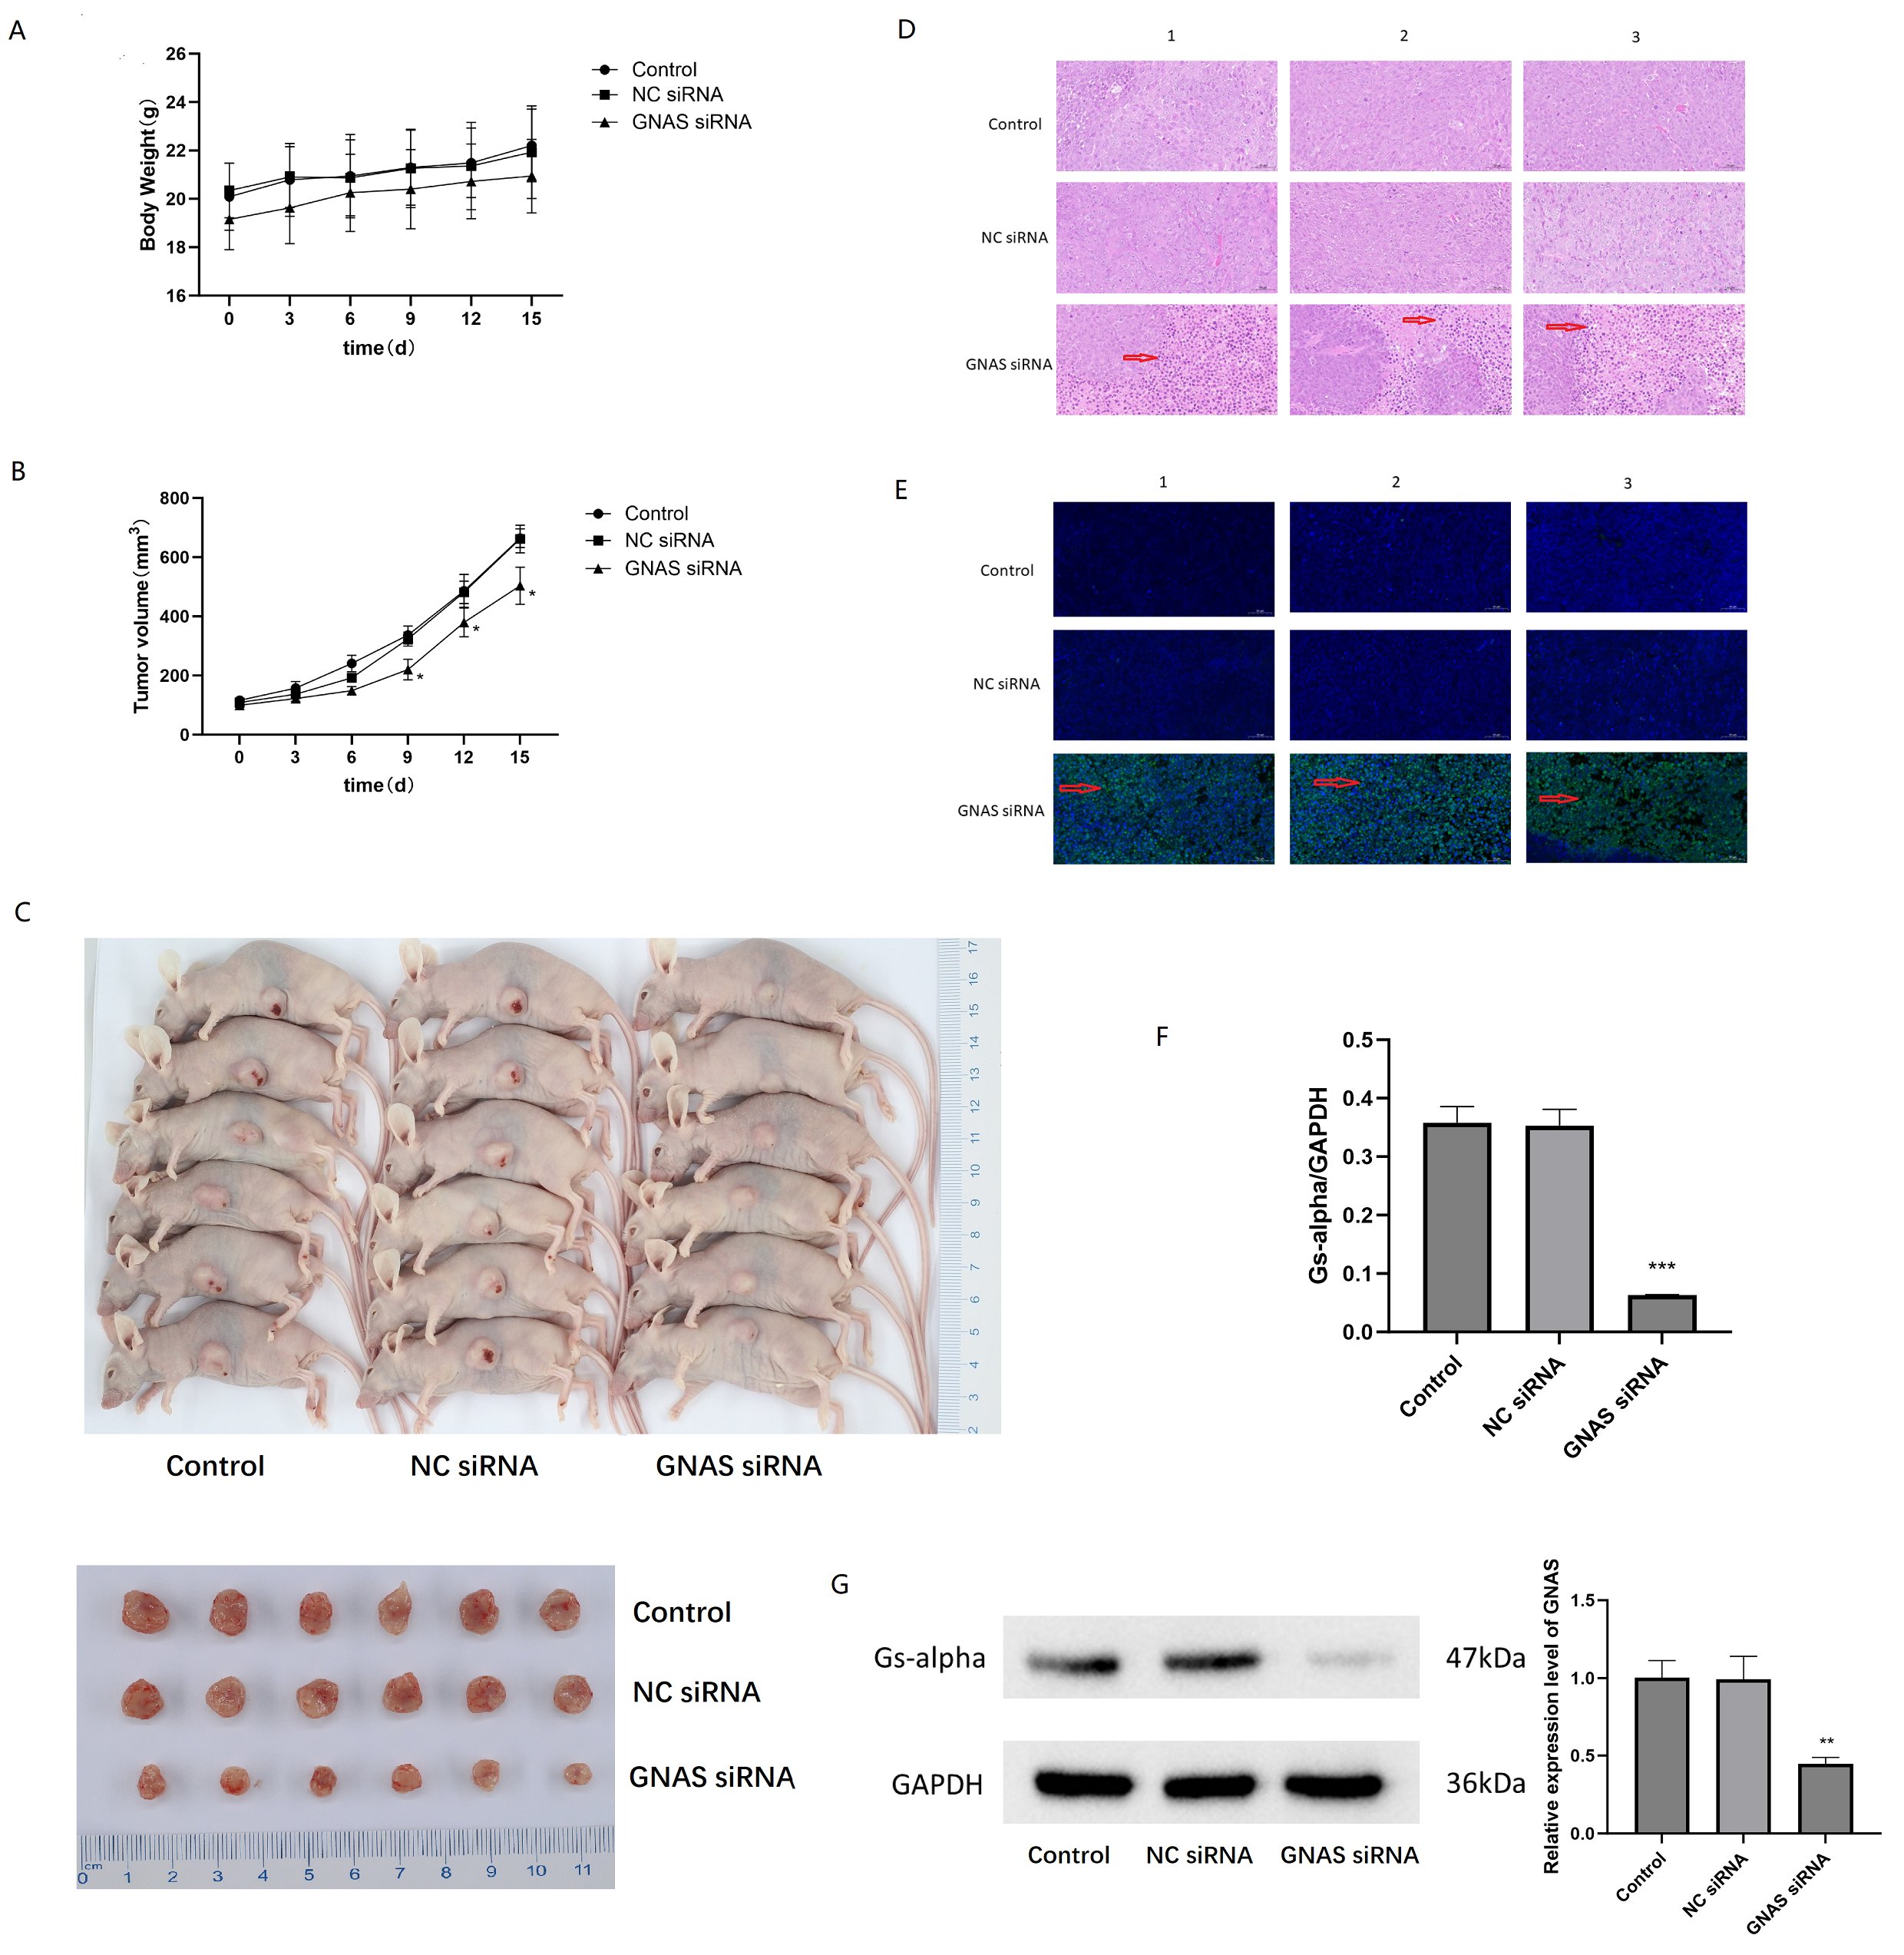
Fig. 8: Inhibition of GNAS induced apoptosis in 143B cells. A Analysis of changes in tumor weight of nude mice at different time points after knocking down GNAS. B Analyzing the differences in tumor volume changes in nude mice at different time points after knocking down GNAS. C Visual images of subcutaneous tumors isolated from nude mice after 2 weeks of different treatments (transfecting siRNA GNAS or not). D Microscopic observation of morphological changes in osteosarcoma cells by HE staining. E Microscopic observation of morphological changes in osteosarcoma cells by TUNEL staining. F Differential expression of GNAS mRNA level in osteosarcoma tissues with or without transfecting siRNA GNAS, *** represent P<0.001. G Western blot analysis of Gs-alpha in osteosarcoma tissues with or without transfecting siRNA GNAS, ** represent P<0.01.
Discussion
At present, the TAEGET database has not yet provided an expression matrix for normal human bone tissue, and the number of samples of osteosarcoma in the TARGET database is limited. Therefore, in this study, we downloaded high-quality high-throughput sequencing data GSE33382, GSE39055, GSE16088, and GSE16091 from the GEO database for osteosarcoma tissue and normal tissue, and merged the dataset using R software inSilicoMerging package. Identifying significant differentially expressed genes between normal tissue samples and osteosarcoma samples, conducting functional enrichment analysis on differentially expressed genes (DEGs), WGCNA, and Hub gene analysis, it was found that GNAS is abnormally highly expressed in osteosarcoma tissue. In addition, GNAS is significantly correlated with the survival of osteosarcoma patients and is an unfavorable prognostic factor for osteosarcoma. To further investigate whether GNAS also exhibits abnormally high expression in other cancers, this study conducted Pan cancer analysis and found that GNAS is highly expressed in 27 types of cancer out of 34 cancers in the UCSC database, and is associated with poor prognosis in more than ten malignant tumors, including sarcoma. Unfortunately, the UCSC database has not yet included data on the prognosis of osteosarcoma. Therefore, in this study, we integrated research data from multicenter osteosarcoma and found that high expression of GNAS is related to the short survival time of osteosarcoma patients. After the above studies, we believe that GNAS gene may not only be related to cellular osteogenesis, but also to the malignant transformation of tumors. Based on the research of GNAS in different types of cancer in recent years, it is also found that GNAS gene plays the role of oncogene in cancers including breast cancer, pancreatic cancer, acute myeloid leukemia [28-30]. Moreover, GNAS often leads to osteogenesis and promotes tumor growth through genetic mutations [31]. Therefore, this study investigated GNAS gene mutations in osteosarcoma samples. Surprisingly, only 3 out of 7494 cases of soft tissue and bone sarcoma had mutations (GNAS R201H/201C mutation), while the TP53 gene mutation rate reached 30%. No high mutation rate of GNAS gene was found in osteosarcoma tissue. Prior to this study, scholars conducted single GNAS mutation detection on 90 cases of osteosarcoma (in 62 parosteal osteosarcomas, 24 low grade osteosarcomas, and 11 periosteal osteosarcoma), and the results of the study showed that GNAS mutations had not been detected in low-grade central osteosarcoma [15], which is consistent with the results of this study. Since the mutation rate of GNAS in osteosarcoma tissue is not high and GNAS is a poor prognostic factor for osteosarcoma patients, whether GNAS achieves malignant biological functions through proliferation and invasion of osteosarcoma? Therefore, this study further conducted mice model experiments on the results of bioinformatics analysis, and conducted RT-PCR and WB analysis on GNAS expression in osteosarcoma cells. It was found that GNAS is highly expressed in osteosarcoma cells, and its expression decreases after knocking out GNAS, indicating that GNAS plays an important role in the progression of osteosarcoma. Further functional research on the GNAS revealed that knocking down the GNAS gene significantly reduced the proliferation of osteosarcoma cells.
G protein coupled receptor (GPCR) would be composed of Gs-alpha subunit encoded by GNAS gene and G-βγ subunit, which is a key participant in tumor growth and progression [32]. On the contrary, studies in medulloblastoma and basal cell carcinoma have shown that Gs-alpha can also exert anti-cancer effects in tumors derived from ectodermal cells (including neural and epidermal stem/progenitor cells) [33]. Therefore, studying the role of Gs-alpha in osteosarcoma is of great significance. Gs-alpha is associated with osteogenic differentiation. In the early stages of osteogenic differentiation, the expression of Gs-alpha is reduced, and excessive Gs-alpha expression will inhibit osteogenic differentiation [34]. There are multiple pathways through which Gs-alpha regulate osteogenic differentiation, and some signaling pathways have been confirmed. The deletion or inactivation mutation of GNAS gene causes ectopic ossification while enhancing the Hedgehog signaling pathway [35]. In our previous study, we found that osteosarcoma cells promote proliferation of osteosarcoma via Hedgehog signaling pathway [36], which may be the reason for overexpression of GNAS in osteosarcoma tissue. However, we have not yet conducted corresponding study on osteogenesis of osteosarcoma cells. This is also the limitation of this study.
Conclusion
In this study, we analyzed the hub genes of osteosarcoma using WGCNA, identified five survival related hub genes (PROP1, GNAS, CYP4F2, LHX3 and CNGB1) through COX analysis, Pan cancer analysis revealed that GNAS plays a vital role as an oncogene in tumors, and further validated the expression level of GNAS in osteosarcoma using immunohistochemistry. This may help guide further research to comprehensively understand the gene network related to osteosarcoma. More importantly, we first confirmed the mutation rate of GNAS gene in osteosarcoma is not high, targeting the GNAS gene can effectively inhibit the proliferation and invasion of osteosarcoma cells, and GNAS expression testing in osteosarcoma patients is beneficial for determining the degree of malignancy of the tumor. This study may provide valuable evidence for the treatment of osteosarcoma.
Acknowledgements
We would like to express our gratitude to the TARGET and GEO databases for providing clinical information and RNA expression matrix data on osteosarcoma patients. We also appreciate the corresponding technical support provided by the Scientific Compass Technology Platform under Hangzhou Yanqu Information Technology Co., Ltd.
Author Contributions
JQ drafted this manuscript and analyzed the data, YH and YB revised the manuscript, and YB designed and supervised this study.
Funding
This work was supported by The Talent Introduction Science Foundation of Yijishan Hospital, Wannan Medical College (YR20220214), 2022 Anhui Provincial Institute of Translational Medicine Research Project (2022zhyx-C48) and The Key Research Foundation of Wannan Medical College(WK2021Z06).
Ethical approval
The study involving animal experiments was reviewed and approved by the ethics committee of the Yijishan Hospital of Wannan medical college, Wuhu, Anhui, China (WNMC-AWE-2023027, approved 2 March, 2023).
Disclosure Statement
The authors have no conflicts of interest to declare.
References
| 1 | Shoaib Z, Fan TM, Irudayaraj JMK: Osteosarcoma mechanobiology and therapeutic targets. Br J Pharmacol 2022;179:201-217.
https://doi.org/10.1111/bph.15713 |
| 2 | Twenhafel L, Moreno D, Punt T, Kinney M, Ryznar R: Epigenetic Changes Associated with Osteosarcoma: A Comprehensive Review. Cells 2023;12
https://doi.org/10.3390/cells12121595 |
| 3 | Meyerson M, Gabriel S, Getz G: Advances in understanding cancer genomes through second-generation sequencing. Nat Rev Genet 2010;11:685-696.
https://doi.org/10.1038/nrg2841 |
| 4 | Shelkowitz E, Chan CM, Jones T, Nakano SJ, Meeks NJL: A novel GNAS variant presents with disorders of GNAS inactivation and cardiomyopathy. Am J Med Genet A 2022;188:2147-2152.
https://doi.org/10.1002/ajmg.a.62726 |
| 5 | Kolbl H: [The large urodynamic measuring site. Advantages for diagnosis and therapy of female urinary incontinence]. Gynakol Geburtshilfliche Rundsch 1993;33 Suppl 1:66-67.
https://doi.org/10.1159/000272163 |
| 6 | Sakamoto A, Chen M, Kobayashi T, Kronenberg HM, Weinstein LS: Chondrocyte-specific knockout of the G protein G(s)alpha leads to epiphyseal and growth plate abnormalities and ectopic chondrocyte formation. J Bone Miner Res 2005;20:663-671.
https://doi.org/10.1359/JBMR.041210 |
| 7 | Fulzele K, Lai F, Dedic C, Saini V, Uda Y, Shi C, Tuck P, Aronson JL, Liu X, Spatz JM, Wein MN, Divieti Pajevic P: Osteocyte-Secreted Wnt Signaling Inhibitor Sclerostin Contributes to Beige Adipogenesis in Peripheral Fat Depots. J Bone Miner Res 2017;32:373-384.
https://doi.org/10.1002/jbmr.3001 |
| 8 | Carter JM, Inwards CY, Jin L, Evers B, Wenger DE, Oliveira AM, Fritchie KJ: Activating GNAS mutations in parosteal osteosarcoma. Am J Surg Pathol 2014;38:402-409.
https://doi.org/10.1097/PAS.0000000000000144 |
| 9 | Collins MT, Singer FR, Eugster E: McCune-Albright syndrome and the extraskeletal manifestations of fibrous dysplasia. Orphanet J Rare Dis 2012;7 Suppl 1:S4.
https://doi.org/10.1186/1750-1172-7-S1-S4 |
| 10 | Tucker-Bartley A, Selen DJ, Golden E, van Gool R, Ebb D, Mannstadt M, Upadhyay J: Pharmacological Interventions Targeting Pain in Fibrous Dysplasia/McCune-Albright Syndrome. Int J Mol Sci 2023;24
https://doi.org/10.3390/ijms24032550 |
| 11 | Pignata L, Cecere F, Acquaviva F, D'Angelo E, Cioffi D, Pellino V, Palumbo O, Palumbo P, Carella M, Sparago A, De Brasi D, Cerrato F, Riccio A: Co-occurrence of Beckwith-Wiedemann syndrome and pseudohypoparathyroidism type 1B: coincidence or common molecular mechanism? Front Cell Dev Biol 2023;11:1237629.
https://doi.org/10.3389/fcell.2023.1237629 |
| 12 | Turan S, Bastepe M: GNAS Spectrum of Disorders. Curr Osteoporos Rep 2015;13:146-158.
https://doi.org/10.1007/s11914-015-0268-x |
| 13 | Dhanasekaran N, Tsim ST, Dermott JM, Onesime D: Regulation of cell proliferation by G proteins. Oncogene 1998;17:1383-1394.
https://doi.org/10.1038/sj.onc.1202242 |
| 14 | Landis CA, Masters SB, Spada A, Pace AM, Bourne HR, Vallar L: GTPase inhibiting mutations activate the alpha chain of Gs and stimulate adenylyl cyclase in human pituitary tumours. Nature 1989;340:692-696.
https://doi.org/10.1038/340692a0 |
| 15 | Salinas-Souza C, De Andrea C, Bihl M, Kovac M, Pillay N, Forshew T, Gutteridge A, Ye H, Amary MF, Tirabosco R, Toledo SR, Baumhoer D, Flanagan AM: GNAS mutations are not detected in parosteal and low-grade central osteosarcomas. Mod Pathol 2015;28:1336-1342.
https://doi.org/10.1038/modpathol.2015.91 |
| 16 | Johnson WE, Li C, Rabinovic A: Adjusting batch effects in microarray expression data using empirical Bayes methods. Biostatistics 2007;8:118-127.
https://doi.org/10.1093/biostatistics/kxj037 |
| 17 | Ben Salem K, Ben Abdelaziz A: Principal Component Analysis (PCA). Tunis Med 2021;99:383-389.
|
| 18 | Chen Y, Chen S, Lei EP: DiffChIPL: a differential peak analysis method for high-throughput sequencing data with biological replicates based on limma. Bioinformatics 2022;38:4062-4069.
https://doi.org/10.1093/bioinformatics/btac498 |
| 19 | Yu G, Wang LG, Han Y, He QY: clusterProfiler: an R package for comparing biological themes among gene clusters. OMICS 2012;16:284-287.
https://doi.org/10.1089/omi.2011.0118 |
| 20 | Langfelder P, Horvath S: WGCNA: an R package for weighted correlation network analysis. BMC Bioinformatics 2008;9:559.
https://doi.org/10.1186/1471-2105-9-559 |
| 21 | Wang N, Wang W, Mao W, Kuerbantayi N, Jia N, Chen Y, Zhou F, Yin L, Wang Y: RBBP4 Enhances Platinum Chemo Resistance in Lung Adenocarcinoma. Biomed Res Int 2021;2021:6905985.
https://doi.org/10.1155/2021/6905985 |
| 22 | Pileri P, Campagnoli S, Grandi A, Parri M, De Camilli E, Song C, Ganfini L, Lacombe A, Naldi I, Sarmientos P, Cinti C, Jin B, Grandi G, Viale G, Terracciano L, Grifantini R: FAT1: a potential target for monoclonal antibody therapy in colon cancer. Br J Cancer 2016;115:40-51.
https://doi.org/10.1038/bjc.2016.145 |
| 23 | Shi H, Suo Y, Zhang Z, Liu R, Liu H, Cheng Z: Copper(II)-disulfiram loaded melanin-dots for cancer theranostics. Nanomedicine 2021;32:102340.
https://doi.org/10.1016/j.nano.2020.102340 |
| 24 | Qi J, Zhang R, Wang Y: Exosomal miR-21-5p derived from bone marrow mesenchymal stem cells promote osteosarcoma cell proliferation and invasion by targeting PIK3R1. J Cell Mol Med 2021;25:11016-11030.
https://doi.org/10.1111/jcmm.17024 |
| 25 | Zeng M, Zhou J, Wen L, Zhu Y, Luo Y, Wang W: The relationship between the expression of Ki-67 and the prognosis of osteosarcoma. BMC Cancer 2021;21:210.
https://doi.org/10.1186/s12885-021-07880-y |
| 26 | Mardanpour K, Rahbar M, Mardanpour S: Coexistence of HER2, Ki67, and p53 in Osteosarcoma: A Strong Prognostic Factor. N Am J Med Sci 2016;8:210-214.
https://doi.org/10.4103/1947-2714.183013 |
| 27 | Tashakori M, Kadia T, Loghavi S, Daver N, Kanagal-Shamanna R, Pierce S, Sui D, Wei P, Khodakarami F, Tang Z, Routbort M, Bivins CA, Jabbour EJ, Medeiros LJ, Bhalla K, Kantarjian HM, Ravandi F, Khoury JD: TP53 copy number and protein expression inform mutation status across risk categories in acute myeloid leukemia. Blood 2022;140:58-72.
https://doi.org/10.1182/blood.2021013983 |
| 28 | Jin X, Zhu L, Cui Z, Tang J, Xie M, Ren G: Elevated expression of GNAS promotes breast cancer cell proliferation and migration via the PI3K/AKT/Snail1/E-cadherin axis. Clin Transl Oncol 2019;21:1207-1219.
https://doi.org/10.1007/s12094-019-02042-w |
| 29 | Ohtsuka T, Tomosugi T, Kimura R, Nakamura S, Miyasaka Y, Nakata K, Mori Y, Morita M, Torata N, Shindo K, Ohuchida K, Nakamura M: Clinical assessment of the GNAS mutation status in patients with intraductal papillary mucinous neoplasm of the pancreas. Surg Today 2019;49:887-893.
https://doi.org/10.1007/s00595-019-01797-7 |
| 30 | Hu C, Fu X, Li S, Chen C, Zhao X, Peng J: Chidamide inhibits cell glycolysis in acute myeloid leukemia by decreasing N6-methyladenosine-related GNAS-AS1. Daru 2023
https://doi.org/10.1007/s40199-023-00482-y |
| 31 | More A, Ito I, Haridas V, Chowdhury S, Gu Y, Dickson P, Fowlkes N, Shen JP: Oncogene addiction to GNAS in GNAS(R201) mutant tumors. Oncogene 2022;41:4159-4168.
https://doi.org/10.1038/s41388-022-02388-6 |
| 32 | Rao R, Salloum R, Xin M, Lu QR: The G protein Galphas acts as a tumor suppressor in sonic hedgehog signaling-driven tumorigenesis. Cell Cycle 2016;15:1325-1330.
https://doi.org/10.1080/15384101.2016.1164371 |
| 33 | Iglesias-Bartolome R, Torres D, Marone R, Feng X, Martin D, Simaan M, Chen M, Weinstein LS, Taylor SS, Molinolo AA, Gutkind JS: Inactivation of a Galpha(s)-PKA tumour suppressor pathway in skin stem cells initiates basal-cell carcinogenesis. Nat Cell Biol 2015;17:793-803.
https://doi.org/10.1038/ncb3164 |
| 34 | Zhang S, Kaplan FS, Shore EM: Different roles of GNAS and cAMP signaling during early and late stages of osteogenic differentiation. Horm Metab Res 2012;44:724-731.
https://doi.org/10.1055/s-0032-1321845 |
| 35 | Regard JB, Malhotra D, Gvozdenovic-Jeremic J, Josey M, Chen M, Weinstein LS, Lu J, Shore EM, Kaplan FS, Yang Y: Activation of Hedgehog signaling by loss of GNAS causes heterotopic ossification. Nat Med 2013;19:1505-1512.
https://doi.org/10.1038/nm.3314 |
| 36 | Qi J, Zhou Y, Jiao Z, Wang X, Zhao Y, Li Y, Chen H, Yang L, Zhu H, Li Y: Exosomes Derived from Human Bone Marrow Mesenchymal Stem Cells Promote Tumor Growth Through Hedgehog Signaling Pathway. Cell Physiol Biochem 2017;42:2242-2254.
https://doi.org/10.1159/000479998 |